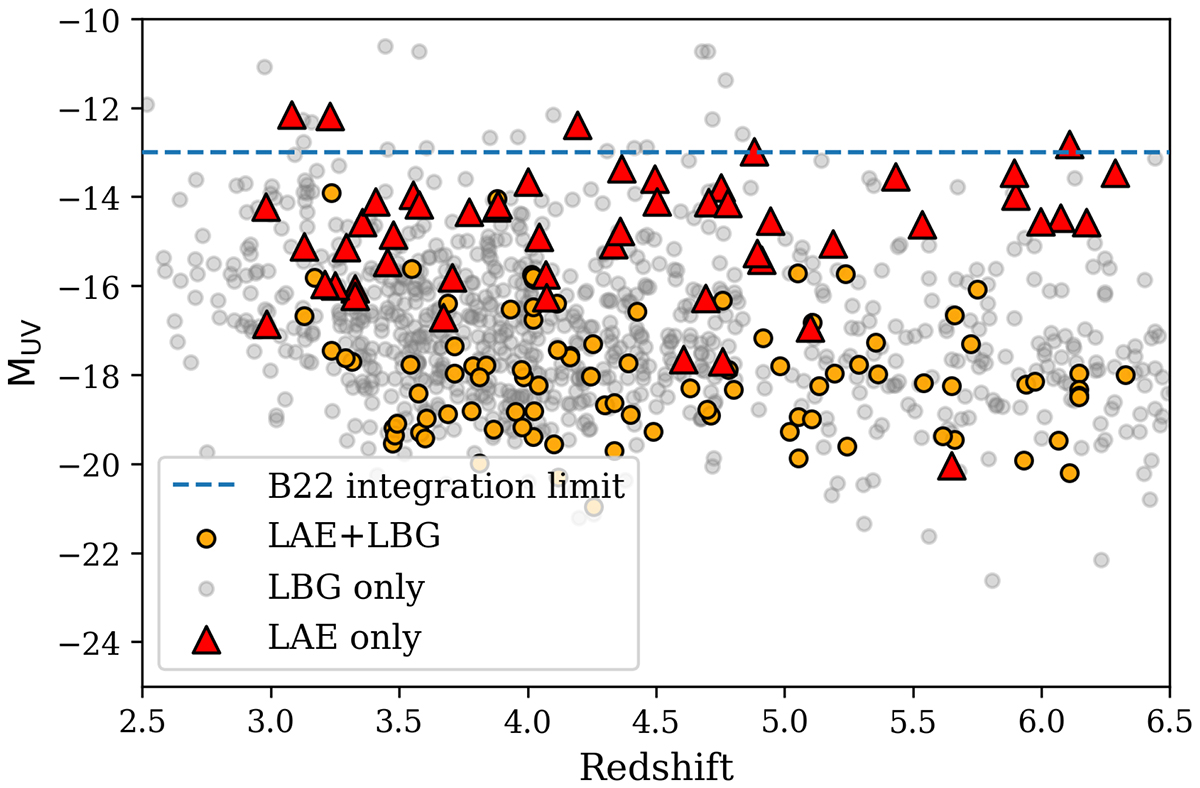
Fig. 6.
Download original image
Redshift and MUV distribution of LAEs and Lyman-break galaxies (UV-selected galaxies) from the sample in Goovaerts et al. (2023). Grey points denote the Lyman-break galaxies and are thus analogous to the UV-selected sample. Orange points denote objects that were selected as LBGs and LAEs and upwards-facing triangles indicate LAEs that were not detected at all in the HST imaging (Shipley et al. 2018). The 2σ upper limits for the continuum of these objects have been estimated using the local noise in the region where they would have been detected in the HST image that would see the 1500 Å emission. The horizontal dashed line denotes the integration limit in the ρtotal calculation in Bouwens et al. (2022).
Current usage metrics show cumulative count of Article Views (full-text article views including HTML views, PDF and ePub downloads, according to the available data) and Abstracts Views on Vision4Press platform.
Data correspond to usage on the plateform after 2015. The current usage metrics is available 48-96 hours after online publication and is updated daily on week days.
Initial download of the metrics may take a while.