Fig. 4.
Download original image
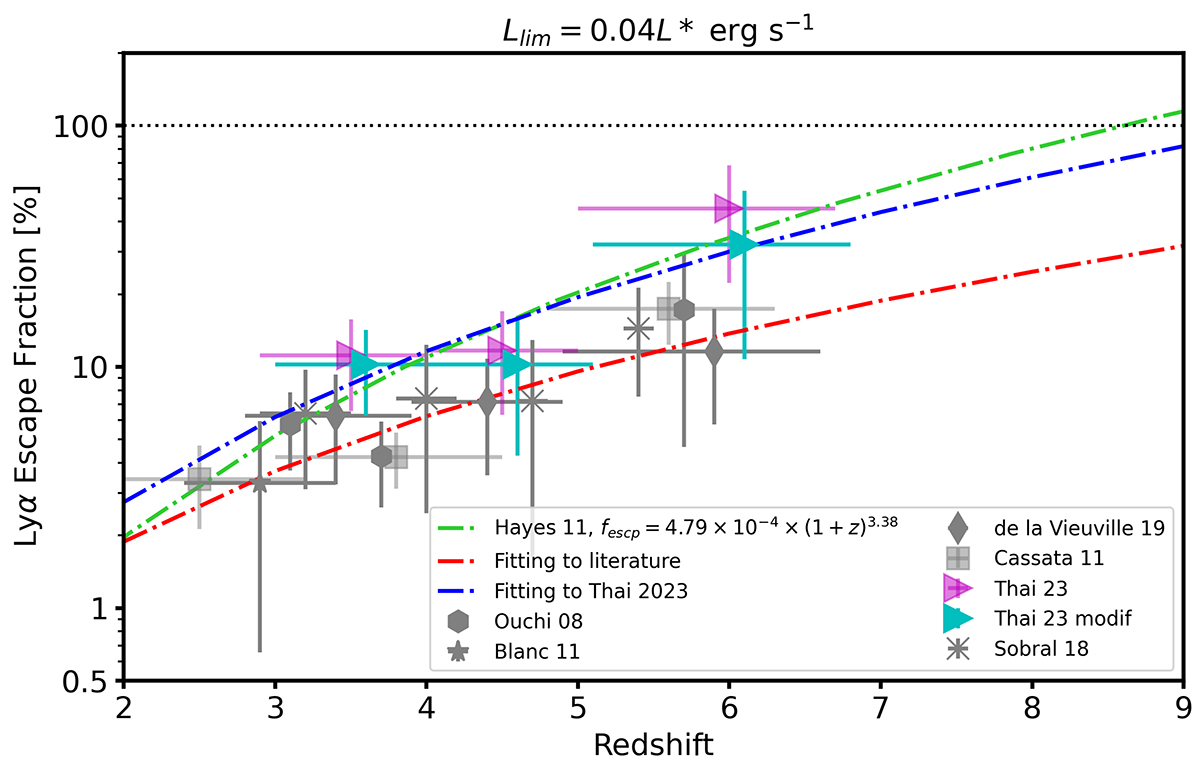
Global redshift evolution of fesc, Lyα with an integration limit on both LFs of 0.04L*. Our results, using the LFs from Thai et al. (2023) are shown in cyan for the modified Schechter function and pink for the general Schechter function. The dotted horizontal line denotes fesc = 100%. The dash-dotted green curve is from Hayes et al. (2011) in the redshift range of 2.2 − 6.6 and calculated with the integration limit 0.04L*. The red dash-dotted curve is the best fit to all the data shown and the blue dash-dotted curve fits just the data of Thai et al. (2023) (cyan points: modified Schechter function).
Current usage metrics show cumulative count of Article Views (full-text article views including HTML views, PDF and ePub downloads, according to the available data) and Abstracts Views on Vision4Press platform.
Data correspond to usage on the plateform after 2015. The current usage metrics is available 48-96 hours after online publication and is updated daily on week days.
Initial download of the metrics may take a while.