Fig. 8
Download original image
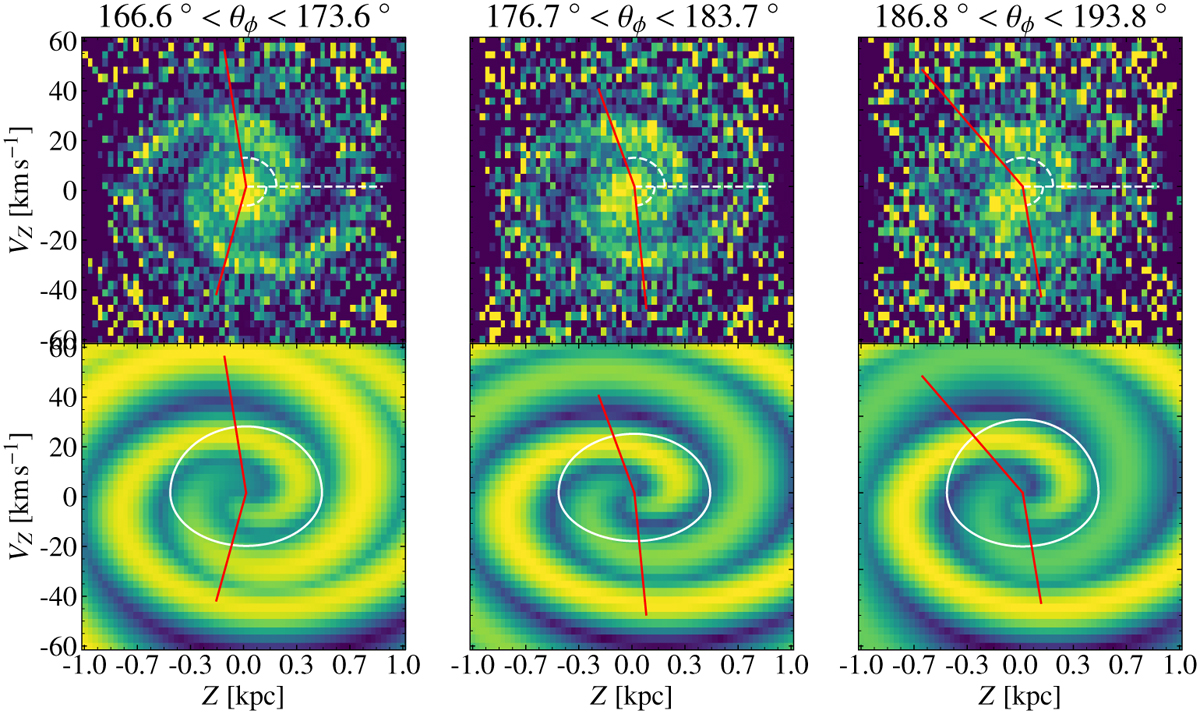
Visualisation of how the angle of the arms of the phase spiral is found. Upper row: number density contrast of the two-armed phase spiral at low, medium, and high θϕ. The spiral angle is marked with a red line and the zero-point for the angle is a dashed white line. Lower row: model of the two-armed phase spiral corresponding to the data in the top row. The spiral angle and measurement distance are marked with a red line and a white ring respectively.
Current usage metrics show cumulative count of Article Views (full-text article views including HTML views, PDF and ePub downloads, according to the available data) and Abstracts Views on Vision4Press platform.
Data correspond to usage on the plateform after 2015. The current usage metrics is available 48-96 hours after online publication and is updated daily on week days.
Initial download of the metrics may take a while.