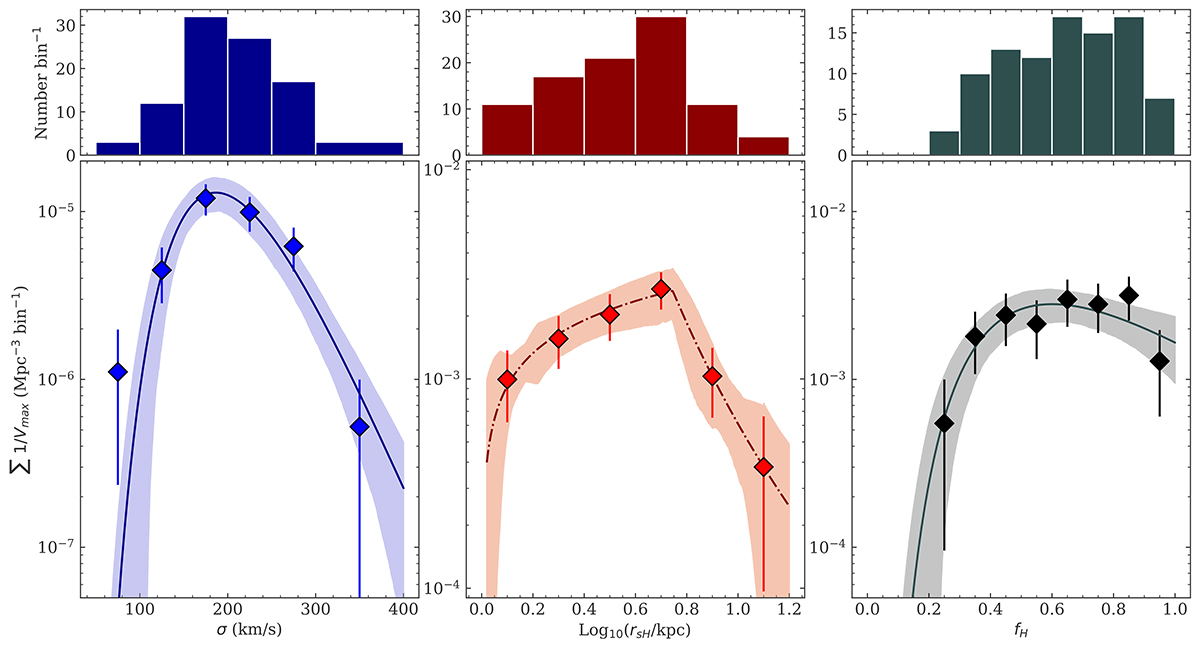
Fig. 9.
Download original image
Differential parameter distributions for critical LAH physical characteristics. The panels show distributions for σ (blue), rsH (red), and fH (black), with the top row showing a histogram of input sample LAHs, and the bottom panel the binned 1/Vmax distributions. Individual bins are shown as diamonds with error bars, with the best functional fit shown by the solid or dot-dash lines. Solid lines are lognormal fits, used for the σ and fH distributions, while the rsH distribution was best fit by a broken power law (dot-dash line). The shaded region shows the inter-quartile range of possible fit parameters. The best-fit values are given in Table 2.
Current usage metrics show cumulative count of Article Views (full-text article views including HTML views, PDF and ePub downloads, according to the available data) and Abstracts Views on Vision4Press platform.
Data correspond to usage on the plateform after 2015. The current usage metrics is available 48-96 hours after online publication and is updated daily on week days.
Initial download of the metrics may take a while.