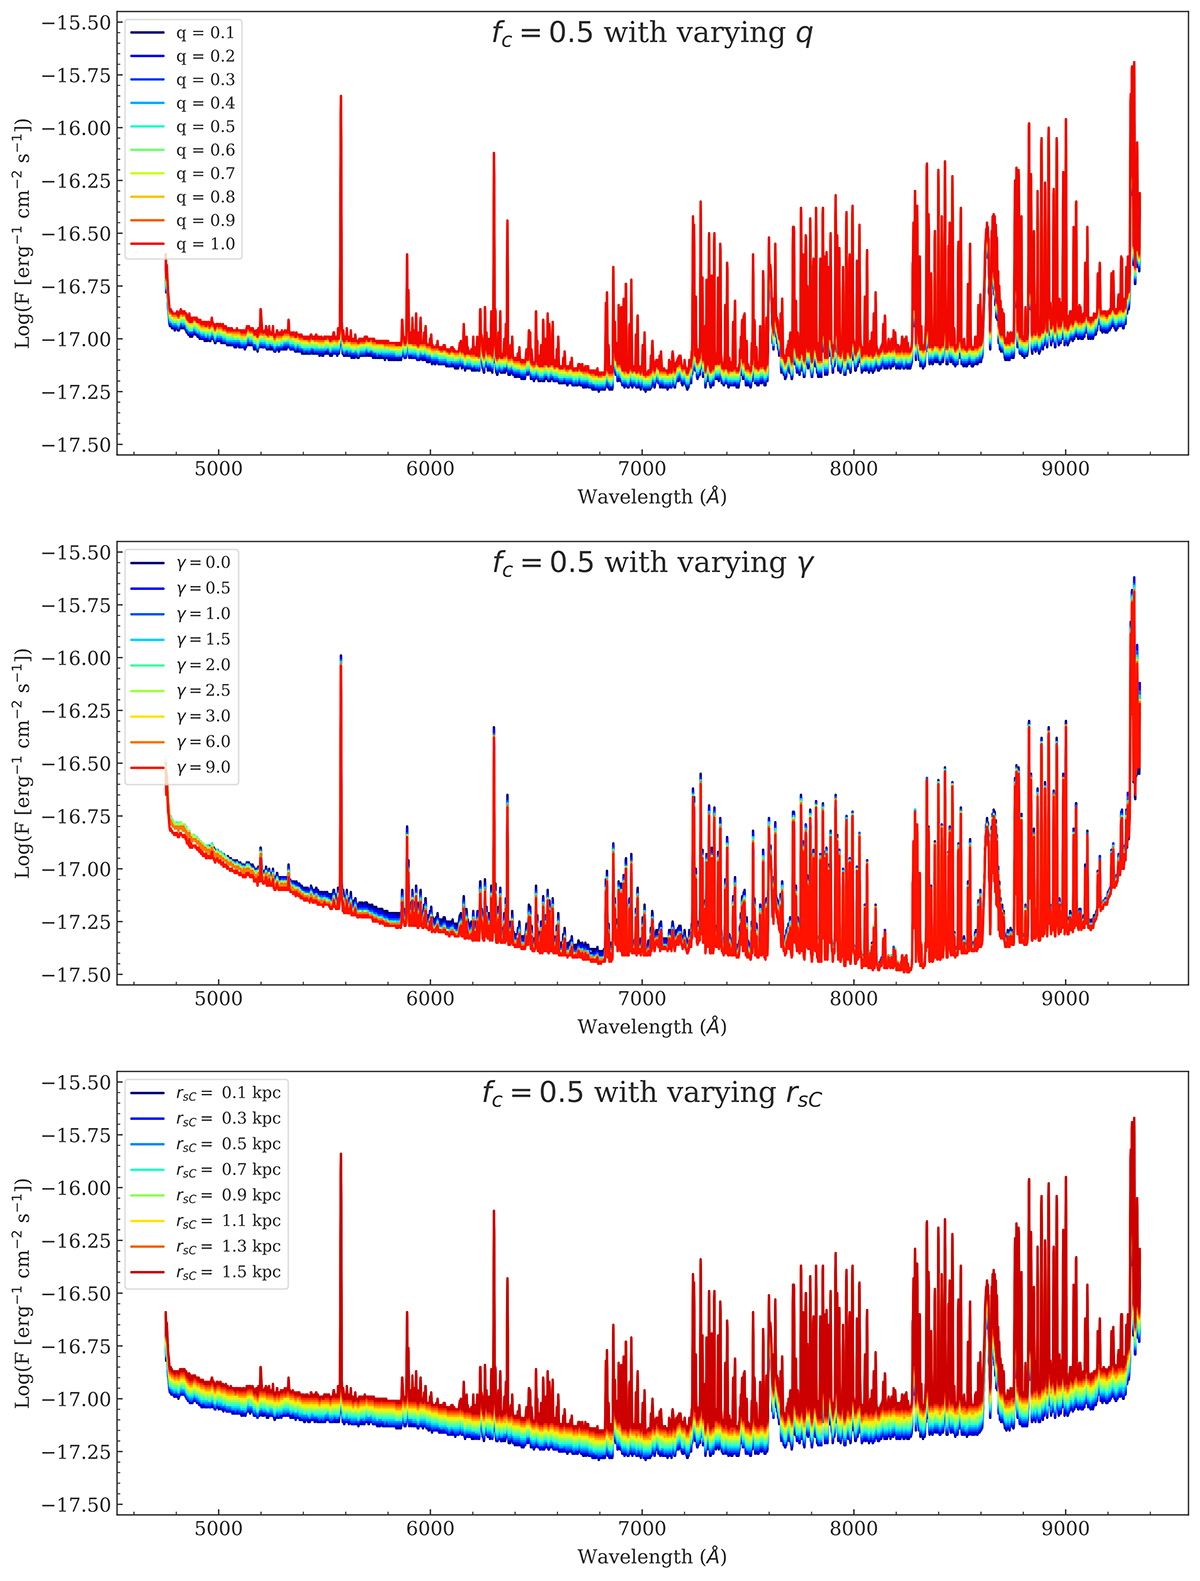
Fig. 4.
Download original image
Individual parameter tests for three of the LAH model parameters. Each panel gives the completeness fraction fC = 0.5 as a function of intrinsic line flux and wavelength for a commonly observed range of a given parameter’s values (shown by the colored curves), with the remaining five parameters held fixed at an average value. This demonstrates the variable contribution to the detectability each parameter can make, with γ changing the 50% detection point by only ∼0.05 dex in intrinsic flux, while the q and rsC lead to average changes of 0.08 and 0.13 dex, respectively.
Current usage metrics show cumulative count of Article Views (full-text article views including HTML views, PDF and ePub downloads, according to the available data) and Abstracts Views on Vision4Press platform.
Data correspond to usage on the plateform after 2015. The current usage metrics is available 48-96 hours after online publication and is updated daily on week days.
Initial download of the metrics may take a while.