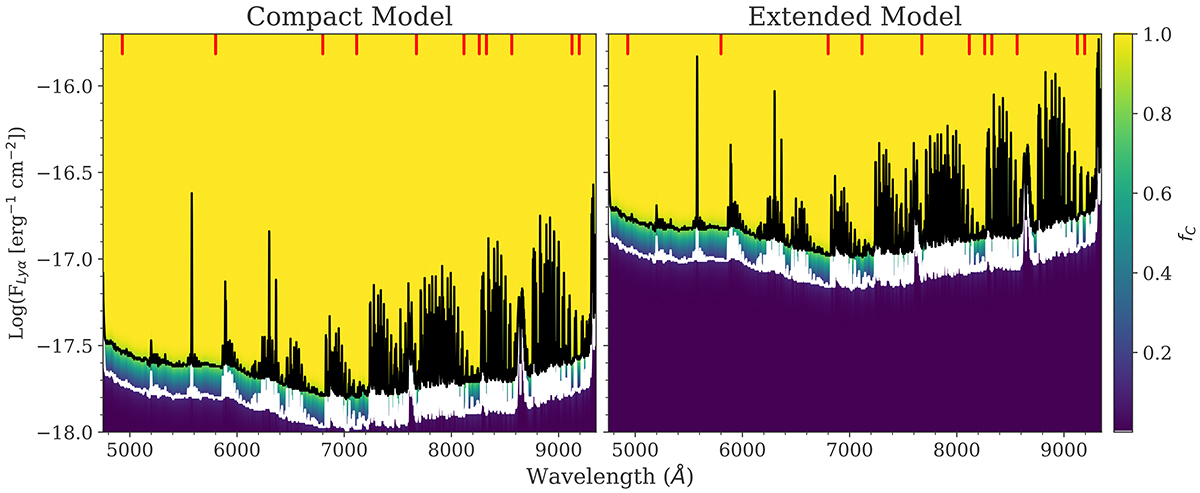
Fig. 3.
Download original image
Selection functions for the compact (left) and extended (right) model emitters shown in Fig. 1. The color of each flux-wavelength point on the grid indicates its fC, the detection completeness fraction estimated by the model for UDF-Mosaic. The black and white curves show lines of fC = 0.85 and fC = 0.15. The model in the left column represents a relatively compact LAH, with a halo flux fraction fH = 0.5, a halo scale length rsH = 1.6 kpc, a spectral line width 126 km/s, and a skew parameter γ = 3. The model in the right column is more extended, with a halo flux fraction fH = 0.9, a halo scale length rsH = 5.0 kpc, a spectral line width 316 km/s, and a skew parameter γ = 0. Vertical red lines near the top of the panels indicate the wavelengths where models were inserted into LSDCat. The selection functions predict that these changes will have a substantial effect on the detectability, with the more compact model achieving fC = 1 down to much fainter line fluxes.
Current usage metrics show cumulative count of Article Views (full-text article views including HTML views, PDF and ePub downloads, according to the available data) and Abstracts Views on Vision4Press platform.
Data correspond to usage on the plateform after 2015. The current usage metrics is available 48-96 hours after online publication and is updated daily on week days.
Initial download of the metrics may take a while.