Fig. 10.
Download original image
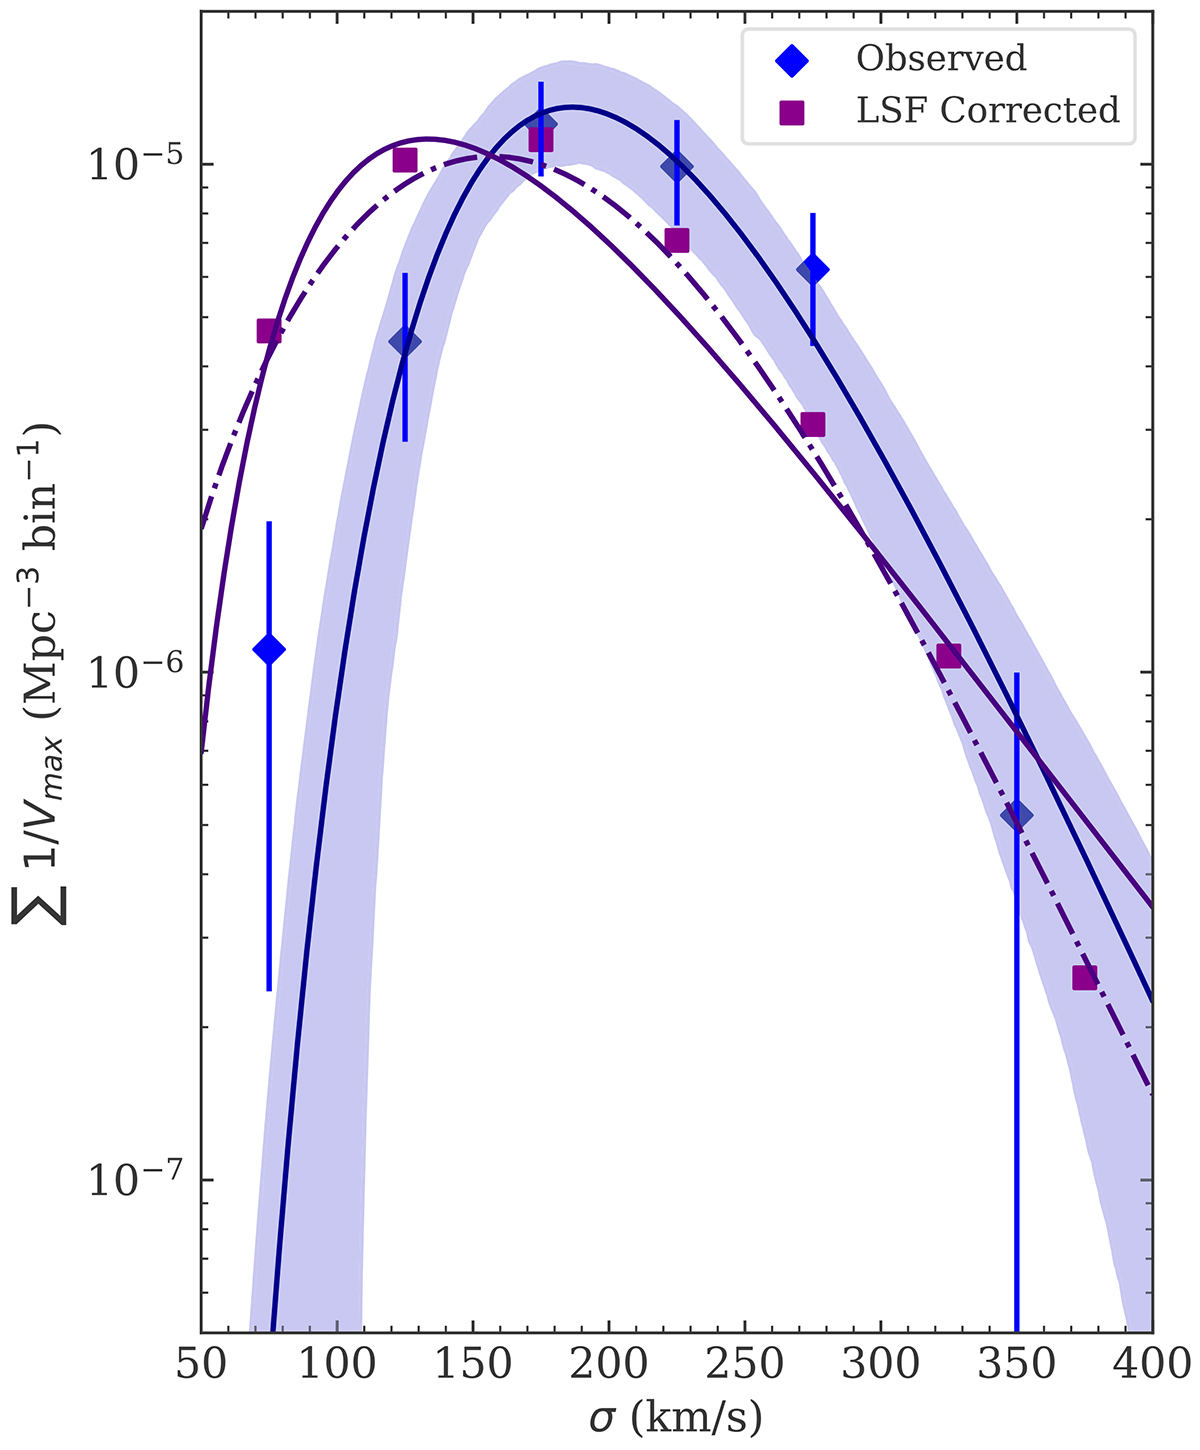
Intrinsic distribution of the line width, σ, in both observed and LSF-corrected forms. Blue diamonds and the blue line and shaded region replicate the distribution from Fig. 9, which is the intrinsic distribution of the observed line widths. This represents a convolution of the physical spread of the line emission with the wavelength-dependent LSF. The purple squares show the intrinsic distribution deconvolved from the LSF, as described in Sect. 4.5. While the observed σ distribution is well fit by a lognormal function, for the LSF-corrected distribution (shown with the solid purple line), this tends to produce a large tail at the high-σ end that is unrealistic for a procedure that reduces the values of σ. A smoothly broken power law function (dot-dash line), as used for the rsH distribution, models the tail end of the distribution more successfully. The LSF deconvolution reduces the σ value of the peak of the distribution from 187 km/s to either 133 km/s (lognormal) or 157 km/s (power law).
Current usage metrics show cumulative count of Article Views (full-text article views including HTML views, PDF and ePub downloads, according to the available data) and Abstracts Views on Vision4Press platform.
Data correspond to usage on the plateform after 2015. The current usage metrics is available 48-96 hours after online publication and is updated daily on week days.
Initial download of the metrics may take a while.