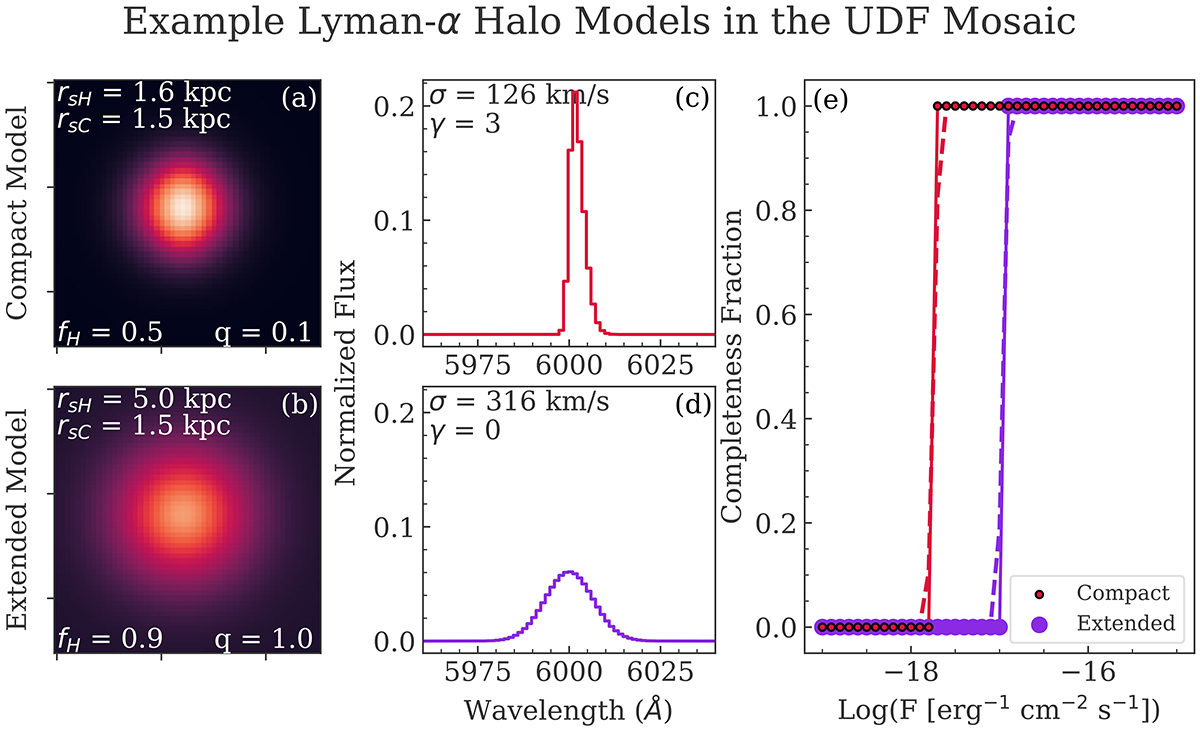
Fig. 1.
Download original image
Two example model LAH profiles set in UDF-Mosaic. The left column shows a spatial profile of the model LAH flux, effectively a narrowband image of the Lyα emission, for a model that is spatially relatively compact (panel a) and for a model that is more extended (panel b). The fluxes in each spaxel are log-normalized here to emphasize the distinct shapes. The values of the spatial parameters used for the model are given in the overlaid text. The middle column shows the normalized Lyα spectral profile for a narrow, skewed line (panel c) and for a broader line with no skew (panel d). The right column (panel e) shows the predicted completeness fraction for the compact and extended model LAHs when inserted into UDF-Mosaic observing conditions at different intrinsic fluxes and at a fixed line center of λ0 = 6000 Å. For the range of fluxes Log(FLyα) = − 15 to −19, each model was inserted into a UDF-Mosaic datacube and its S/N measured. For a chosen detection threshold S/Ndet = 5, we then estimated the completeness fraction for each insertion. This is given by the red (compact) and purple (extended) circles and the trend tracked by the solid lines. Dashed lines show error function models of the detectability function, described in Sect. 2.2. Unsurprisingly, the completeness fraction drops rapidly when the intrinsic flux gets low enough to bring the measured S/N below the detection threshold. This behavior can be accurately modeled by an error function, as shown by the dashed lines. This panel also demonstrates the clear effect of the LAH parameters on the expected detectability of the LAE: the spatially compact, narrow-line model is detectable at fluxes almost an order of magnitude fainter than the extended, broad-line model.
Current usage metrics show cumulative count of Article Views (full-text article views including HTML views, PDF and ePub downloads, according to the available data) and Abstracts Views on Vision4Press platform.
Data correspond to usage on the plateform after 2015. The current usage metrics is available 48-96 hours after online publication and is updated daily on week days.
Initial download of the metrics may take a while.