Fig. 6.
Download original image
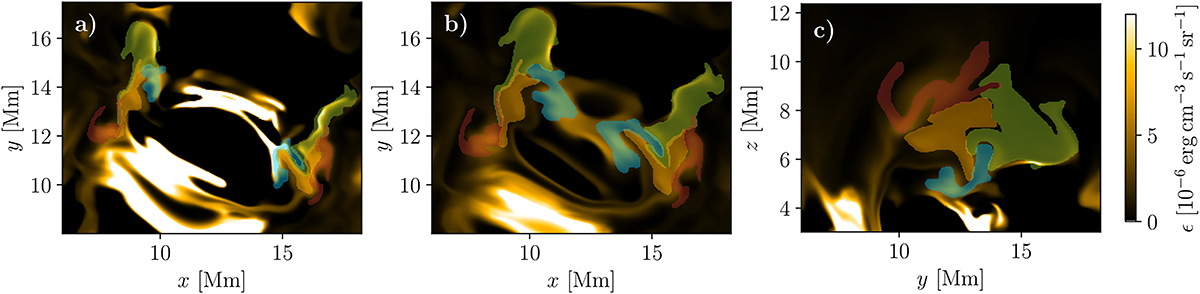
Cuts across the volumetric emissivity along the z = 3 Mm (a), z = 4.5 Mm (b), and x = 13 Mm (c) plane corresponding to cuts across the coronal loop footpoints, coronal loop legs, and the coronal loop apex. The corresponding cuts across the individual waveguides are overplotted in blue (waveguide 1), green (waveguide 2), orange (waveguide 3), and red (waveguide 4).
Current usage metrics show cumulative count of Article Views (full-text article views including HTML views, PDF and ePub downloads, according to the available data) and Abstracts Views on Vision4Press platform.
Data correspond to usage on the plateform after 2015. The current usage metrics is available 48-96 hours after online publication and is updated daily on week days.
Initial download of the metrics may take a while.