Fig. 2.
Download original image
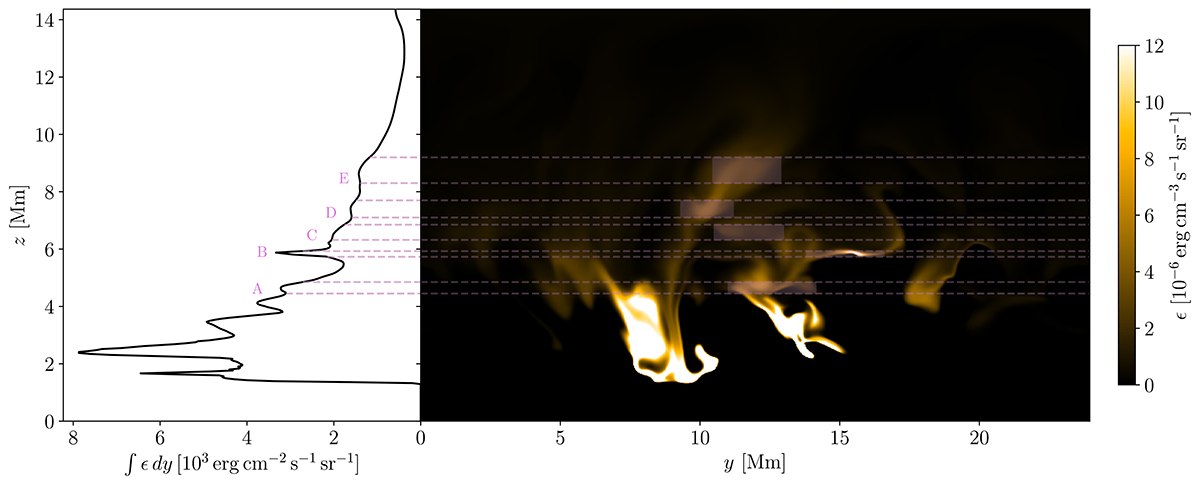
Vertical slice across the volumetric emissivity at x = 13 Mm (right), and the corresponding x = 13 Mm LOS-integrated emission profile (left). The local emission peaks corresponding to the loops A–E are marked by dashed purple lines. These also mark the z-coordinates of the contributing regions in the emissivity slice. The dominant emitting regions corresponding to each loop are marked by purple rectangles.
Current usage metrics show cumulative count of Article Views (full-text article views including HTML views, PDF and ePub downloads, according to the available data) and Abstracts Views on Vision4Press platform.
Data correspond to usage on the plateform after 2015. The current usage metrics is available 48-96 hours after online publication and is updated daily on week days.
Initial download of the metrics may take a while.