Fig. 1.
Download original image
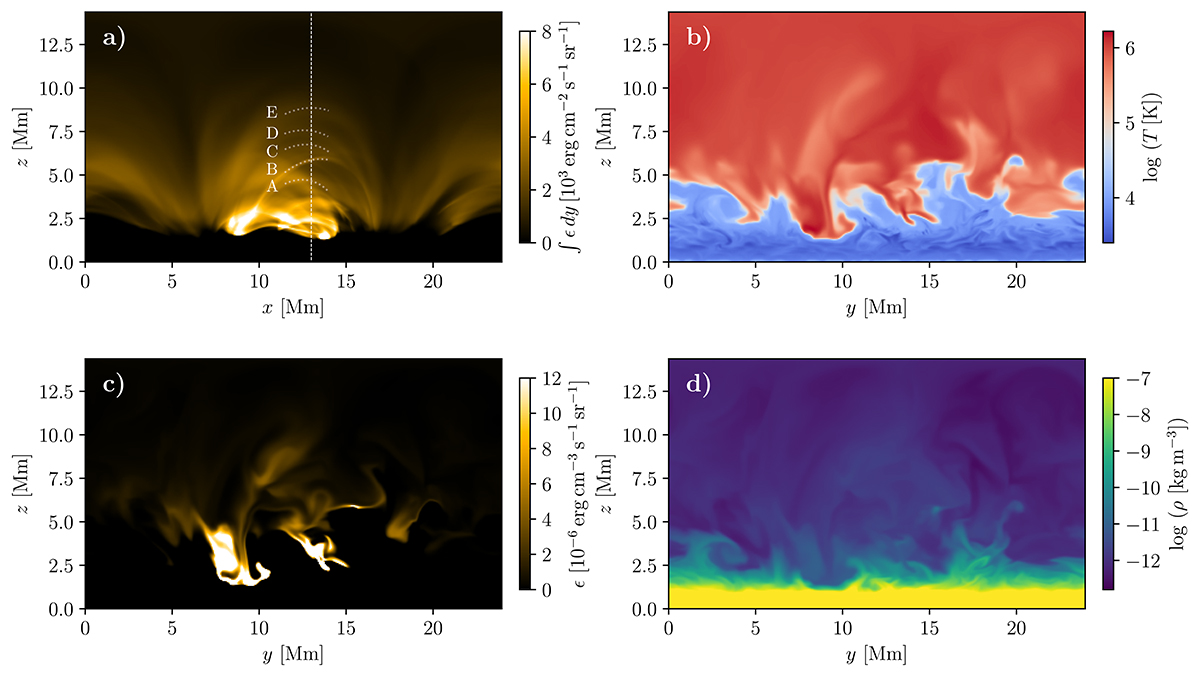
Coronal structure in the simulation. We show the LOS-integrated Fe IX emission intensity in the x–z plane (a). The dashed line at x = 13 Mm marks the y–z plane along which the subsequent slices are taken. The dotted lines mark a portion of the loop axis for loops A–E. Vertical slices taken across the coronal loops at x = 13 Mm show the plasma temperature (b), volumetric emissivity (c), and the plasma density (d).
Current usage metrics show cumulative count of Article Views (full-text article views including HTML views, PDF and ePub downloads, according to the available data) and Abstracts Views on Vision4Press platform.
Data correspond to usage on the plateform after 2015. The current usage metrics is available 48-96 hours after online publication and is updated daily on week days.
Initial download of the metrics may take a while.