Open Access
Fig. 4
Download original image
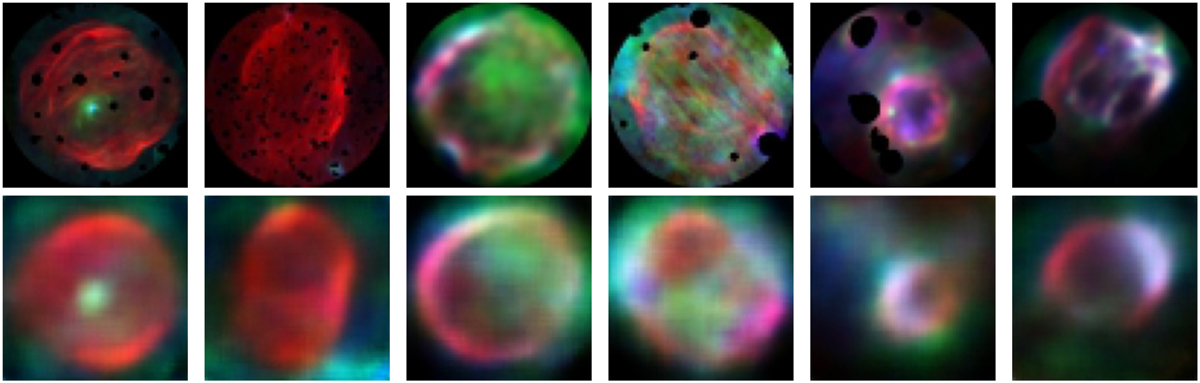
Examples of autoencoder reconstructions. The top row shows a sample of original RGB images, with compact sources masked. The bottom row shows the corresponding reconstructions obtained with the CAE architecture described in Sect. 5.2.
Current usage metrics show cumulative count of Article Views (full-text article views including HTML views, PDF and ePub downloads, according to the available data) and Abstracts Views on Vision4Press platform.
Data correspond to usage on the plateform after 2015. The current usage metrics is available 48-96 hours after online publication and is updated daily on week days.
Initial download of the metrics may take a while.