Fig. 6
Download original image
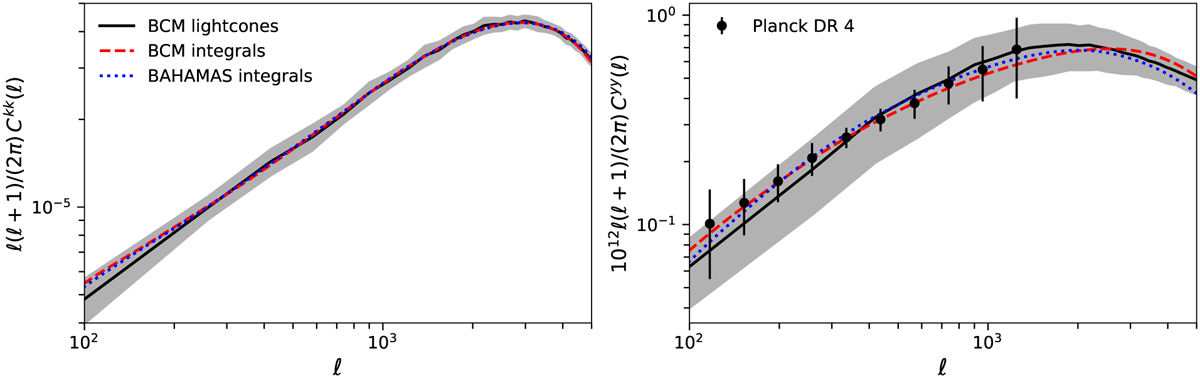
Angular power spectra of convergence (left panel) and tSZ (right panel) using the mean of 30 independent baryonifled lightcones (thick black line) and integrating the power spectra of the snapshots of our baryonifled simulation numerically (dotted blue line). The field of view of each lightcone is 10° × 10°, up to ɀ = 1 (all the sources for convergence are considered to be at ɀ = 1). The shaded area marks the standard deviation of the 30 lightcone realisations. For comparison, we plot the integrals of the 3D power spectra of BAHAMAS TAGN = 107.8 K with dotted blue lines, and the tSZ power spectrum extracted from Plack data release 4 with black circles.
Current usage metrics show cumulative count of Article Views (full-text article views including HTML views, PDF and ePub downloads, according to the available data) and Abstracts Views on Vision4Press platform.
Data correspond to usage on the plateform after 2015. The current usage metrics is available 48-96 hours after online publication and is updated daily on week days.
Initial download of the metrics may take a while.