Fig. 5
Download original image
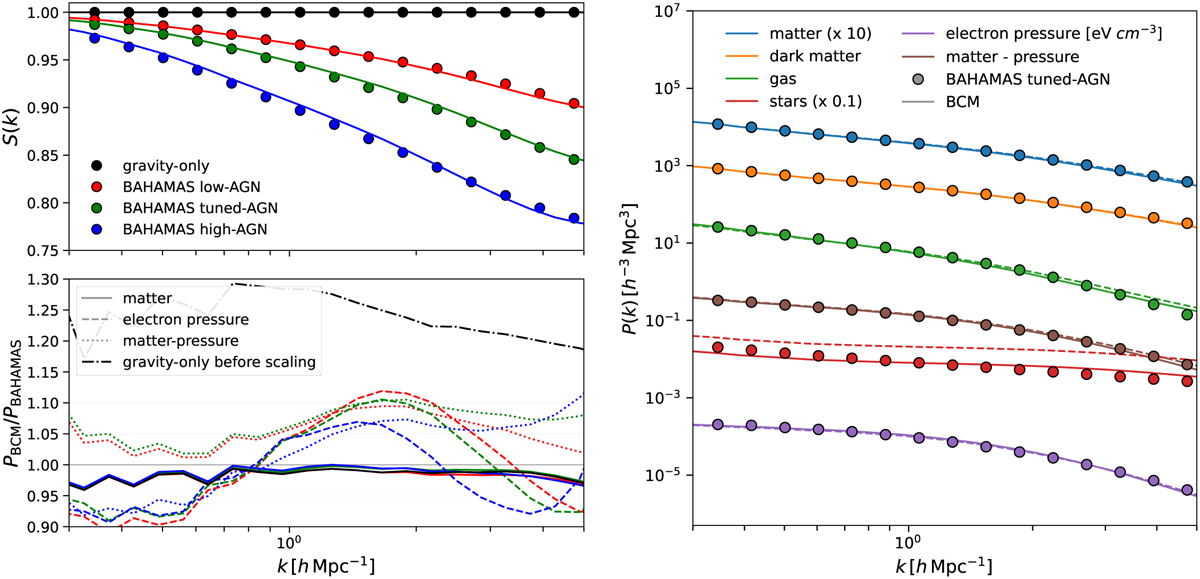
Comparison between BAHAMAS and BCM power spectra. Left panel, top: Matter power spectrum suppression S (k) measured at ɀ = 0 in three BAHAMAS simulations, with an AGN temperature of TAGN = 107.6, 107.8, and 108.0 K (red, green, and blue circles, respectively). As solid lines, we show the respective predictions of baryoniflcation when simultaneously fitting the S (k), the electron pressure, and the matter-electron pressure power spectra of each simulation. Left panel, bottom: Ratio of power spectra measured in our baryonified simulations to the BAHAMAS ones, for matter (solid lines), electron pressure (dashed lines), and the matter–electron pressure cross (dotted lines). Right panel: Power spectra of matter, dark matter, gas, galaxy, electron pressure (in units of eV cm−3), and matter-electron pressure, measured in BAHAMAS AGN tuned at ɀ = 0 (circles; colours are as described in the legend). We show the baryoniflcation fits to the total matter and electron pressure auto- and cross-correlation with dashed lines, and a simultaneous fit to all the power spectra with solid lines.
Current usage metrics show cumulative count of Article Views (full-text article views including HTML views, PDF and ePub downloads, according to the available data) and Abstracts Views on Vision4Press platform.
Data correspond to usage on the plateform after 2015. The current usage metrics is available 48-96 hours after online publication and is updated daily on week days.
Initial download of the metrics may take a while.