Fig. 9
Download original image
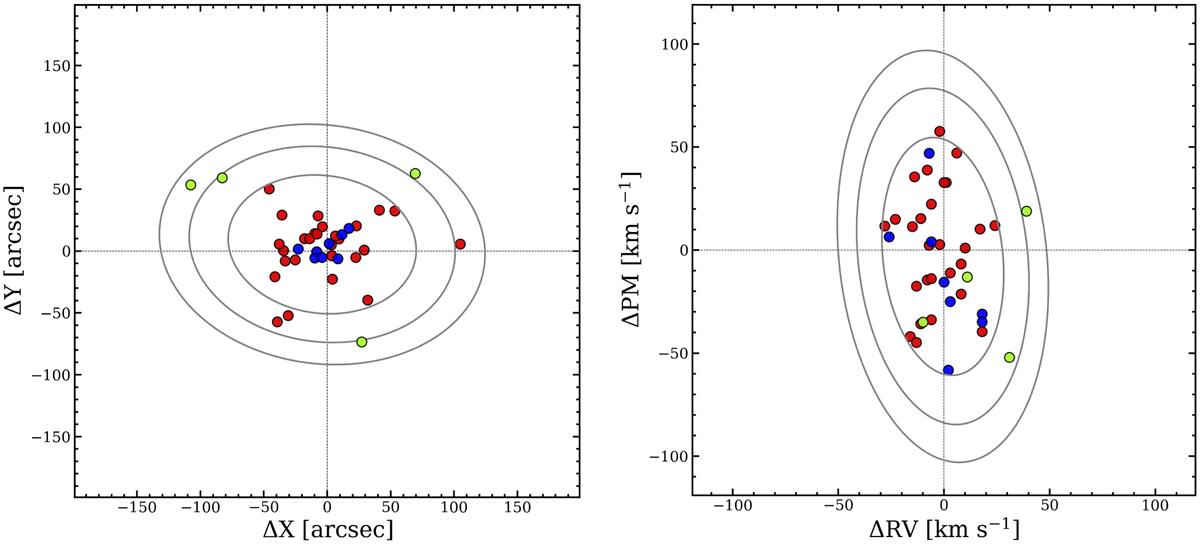
Spatial (in the RA and Dec plane referred to the system center, left panel) and kinematic (in the RV-PM plane referred to the systemic velocities, right panel) distributions of the 39 stars that are likely members of Liller 1, color-coded according to their metal content: red (metal-poor), green (metal-intermediate), and blue (metal-rich). The 1, 2, and 3 σ contour levels from the GMM analysis are also plotted.
Current usage metrics show cumulative count of Article Views (full-text article views including HTML views, PDF and ePub downloads, according to the available data) and Abstracts Views on Vision4Press platform.
Data correspond to usage on the plateform after 2015. The current usage metrics is available 48-96 hours after online publication and is updated daily on week days.
Initial download of the metrics may take a while.