Fig. 7
Download original image
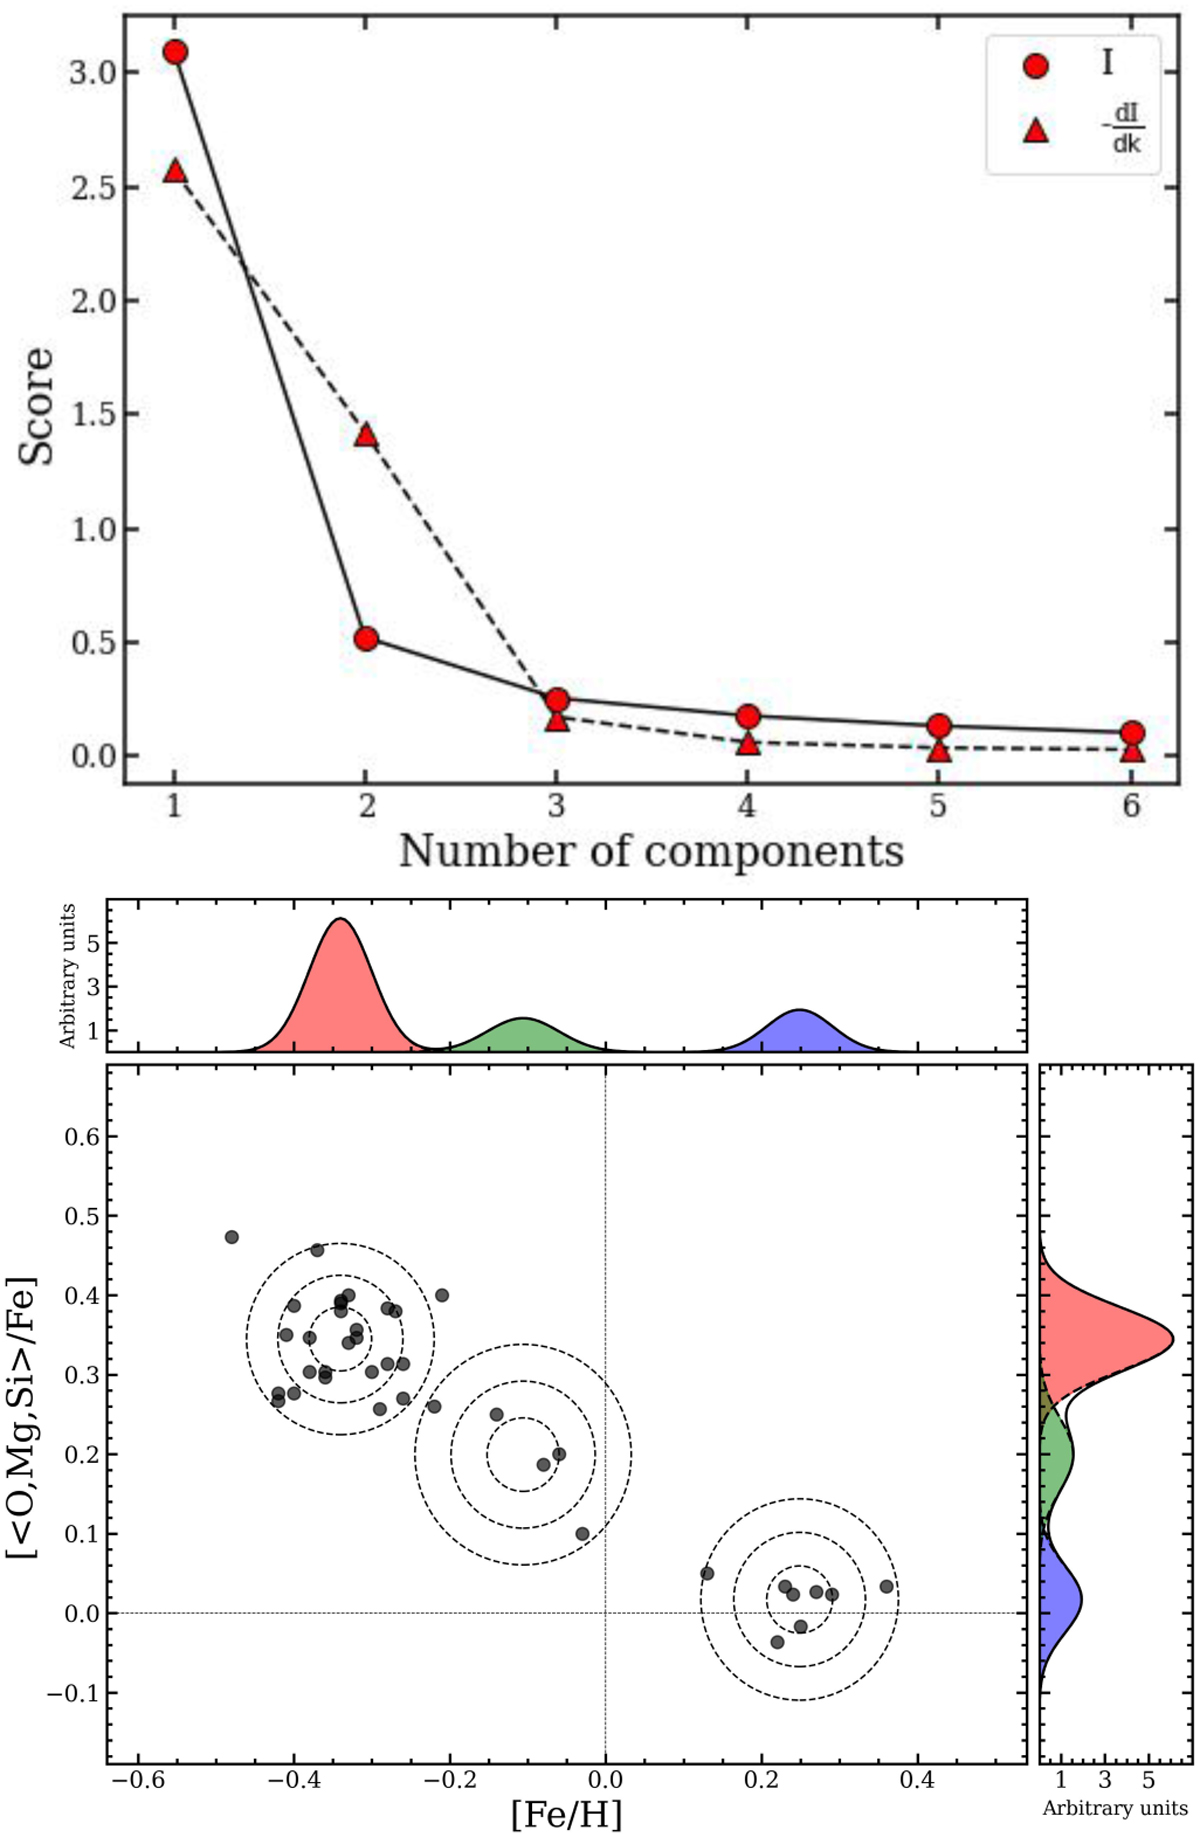
K-means clustering solution for the [<O,Mg,Si>/Fe] vs. [Fe/H] distribution of Liller 1. Bottom panel: distribution for the observed 39 stars (black-filled circles) and best-fit solution with three Gaussian components and 1, 2, and 3 σ contours, where σ is the standard deviation. Top panel: inertia parameter I(k) (red-filled circles and solid line) and its derivative (red triangles and dashed line) as a function of K, the total number of components.
Current usage metrics show cumulative count of Article Views (full-text article views including HTML views, PDF and ePub downloads, according to the available data) and Abstracts Views on Vision4Press platform.
Data correspond to usage on the plateform after 2015. The current usage metrics is available 48-96 hours after online publication and is updated daily on week days.
Initial download of the metrics may take a while.