Fig. 5
Download original image
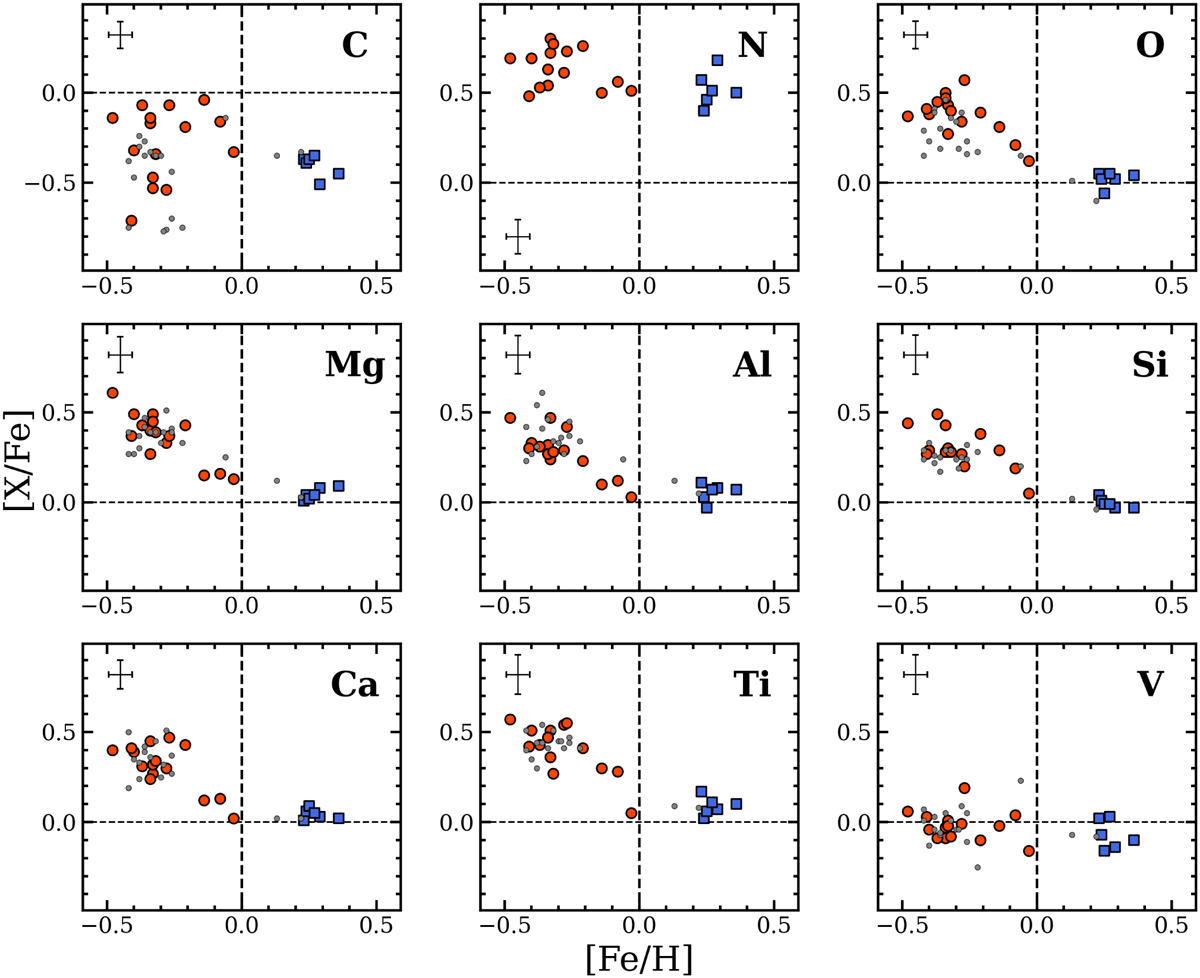
Behavior of [C/Fe], [N/Fe], [O/Fe], [Mg/Fe], [Al/Fe], [Si/Fe], [Ca/Fe], [Ti/Fe], and [V/Fe] as a function of [Fe/H] for the metal-poor (red-filled circles) and metal-rich (blue-filled squares) subpopulations of Liller 1. The gray dots represent the stars of AG24 not in common with the NIRSpec sample. The typical error bars are reported in the left corner of each panel. The dashed vertical and horizontal lines denote the corresponding zero [Fe/H] and [X/Fe] values.
Current usage metrics show cumulative count of Article Views (full-text article views including HTML views, PDF and ePub downloads, according to the available data) and Abstracts Views on Vision4Press platform.
Data correspond to usage on the plateform after 2015. The current usage metrics is available 48-96 hours after online publication and is updated daily on week days.
Initial download of the metrics may take a while.