Open Access
Fig. 4
Download original image
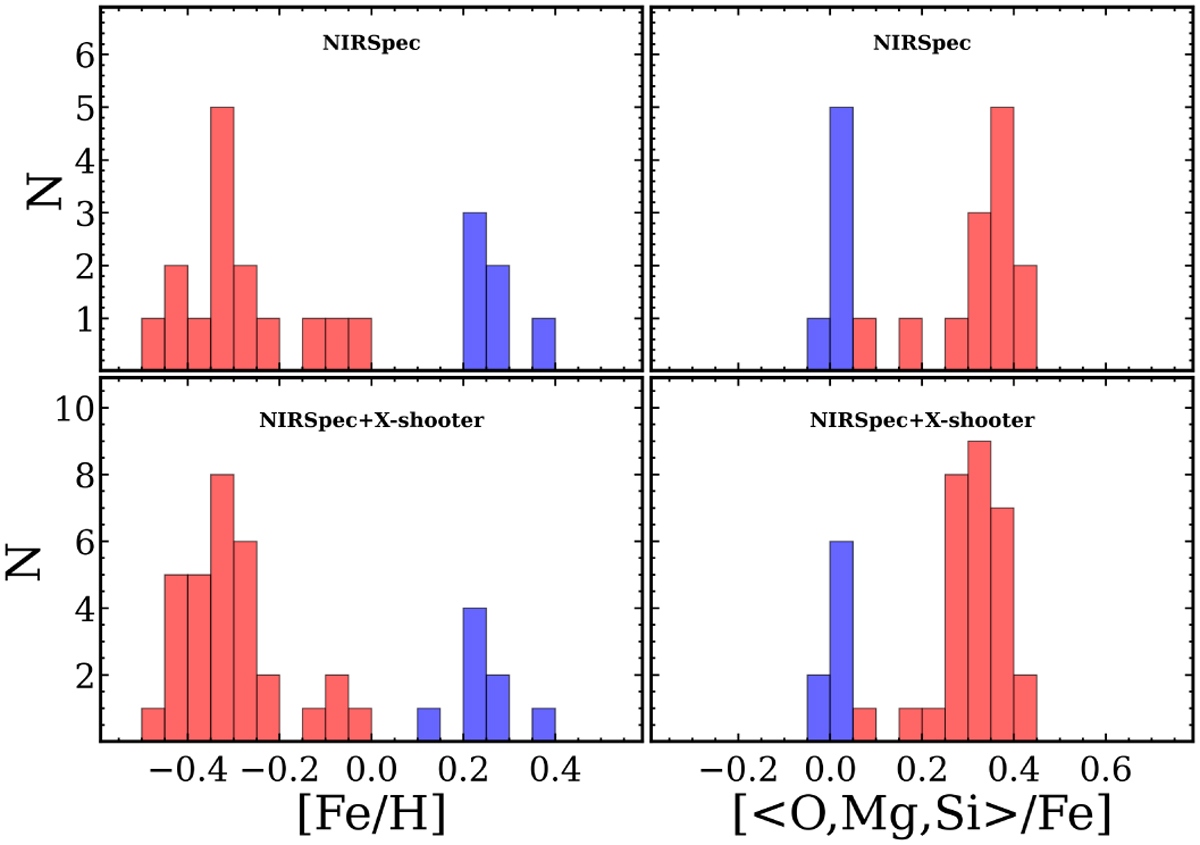
Distribution of the [Fe/H] and [<O,Mg,Si>/Fe] abundance measurements (left and right panels, respectively) obtained in the present work from the analysis of NIRSpec spectra alone (top panel), and in combination with the AG24 sample (bottom panels).
Current usage metrics show cumulative count of Article Views (full-text article views including HTML views, PDF and ePub downloads, according to the available data) and Abstracts Views on Vision4Press platform.
Data correspond to usage on the plateform after 2015. The current usage metrics is available 48-96 hours after online publication and is updated daily on week days.
Initial download of the metrics may take a while.