Open Access
Fig. 3
Download original image
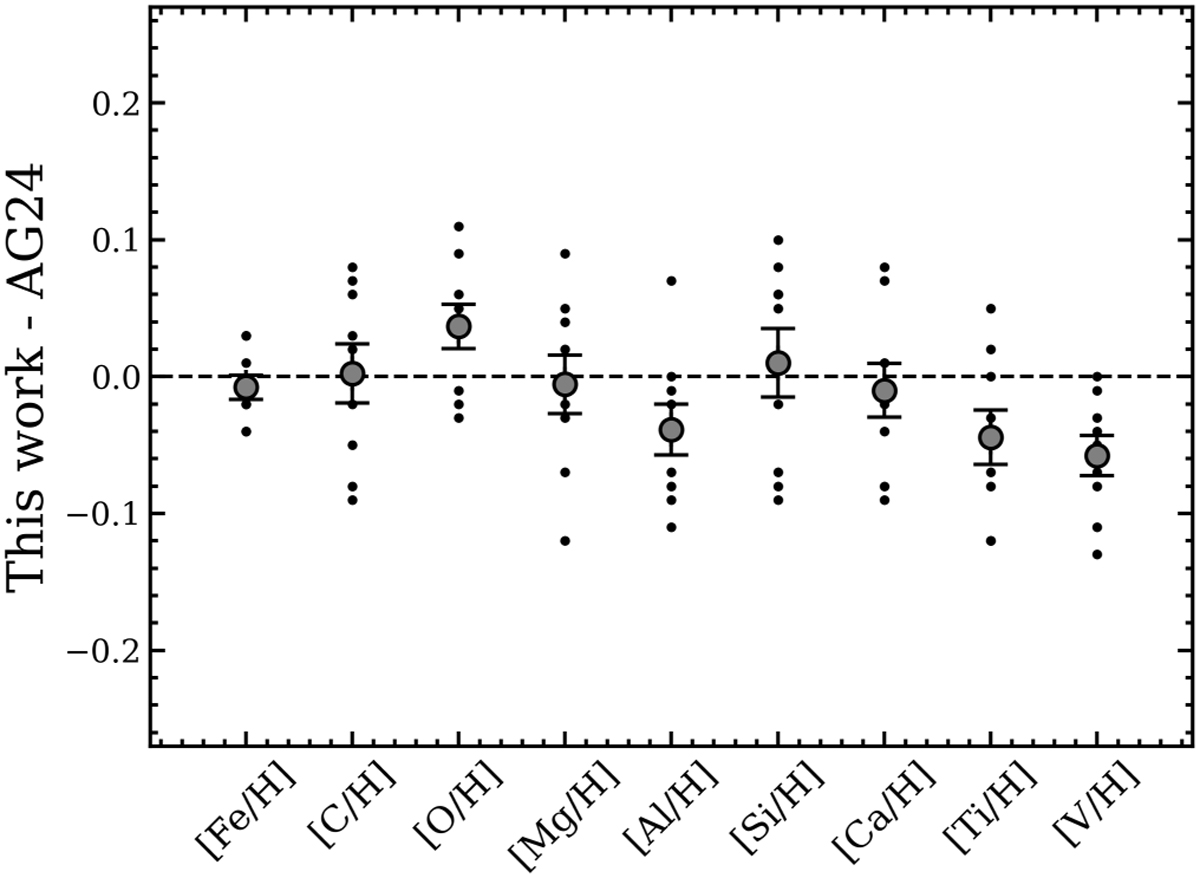
Abundance differences between this work and AG24 for the stars and chemical elements in common. Gray dots refer to the measurements obtained for each individual star, while the black-filled circles represent the average differences along with their associated errors. The dashed horizontal line marks the zero difference.
Current usage metrics show cumulative count of Article Views (full-text article views including HTML views, PDF and ePub downloads, according to the available data) and Abstracts Views on Vision4Press platform.
Data correspond to usage on the plateform after 2015. The current usage metrics is available 48-96 hours after online publication and is updated daily on week days.
Initial download of the metrics may take a while.