Fig. 3
Download original image
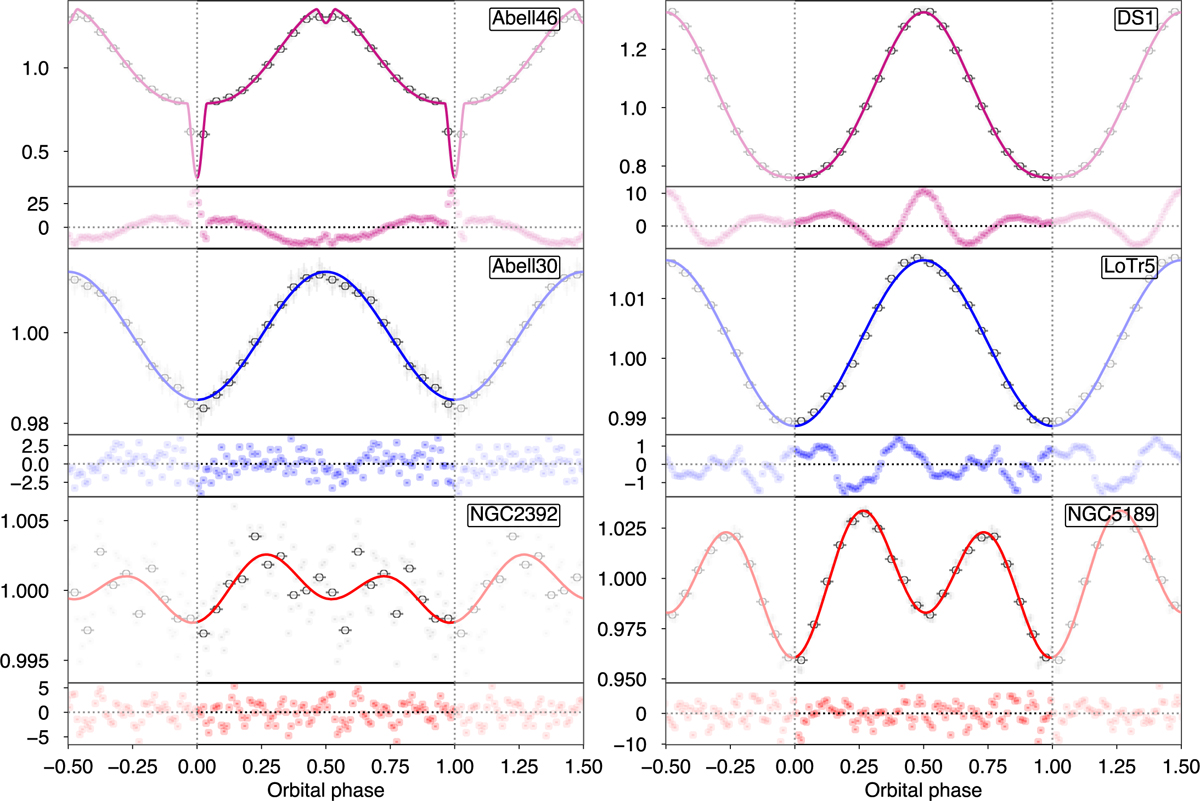
Phase-folded light curves of the already known binaries, with the best-fitting model overlaid. Results from the PHOEBE2 analyses are overplotted in pink and from the MCMC analyses in blue (1E solution) and red (3E solution). Grey symbols correspond to a bin size of 0.01 in phase (i.e. 100 datapoints) while the black symbols correspond to bin sizes of 0.05 in phase (i.e. 20 datapoints). The period derived from the fitting can be found in Table 2 and the corresponding periodograms are shown in Fig. B.2). We note that the period of NGC 5189 does not correspond with the orbital period published in the literature for this binary.
Current usage metrics show cumulative count of Article Views (full-text article views including HTML views, PDF and ePub downloads, according to the available data) and Abstracts Views on Vision4Press platform.
Data correspond to usage on the plateform after 2015. The current usage metrics is available 48-96 hours after online publication and is updated daily on week days.
Initial download of the metrics may take a while.