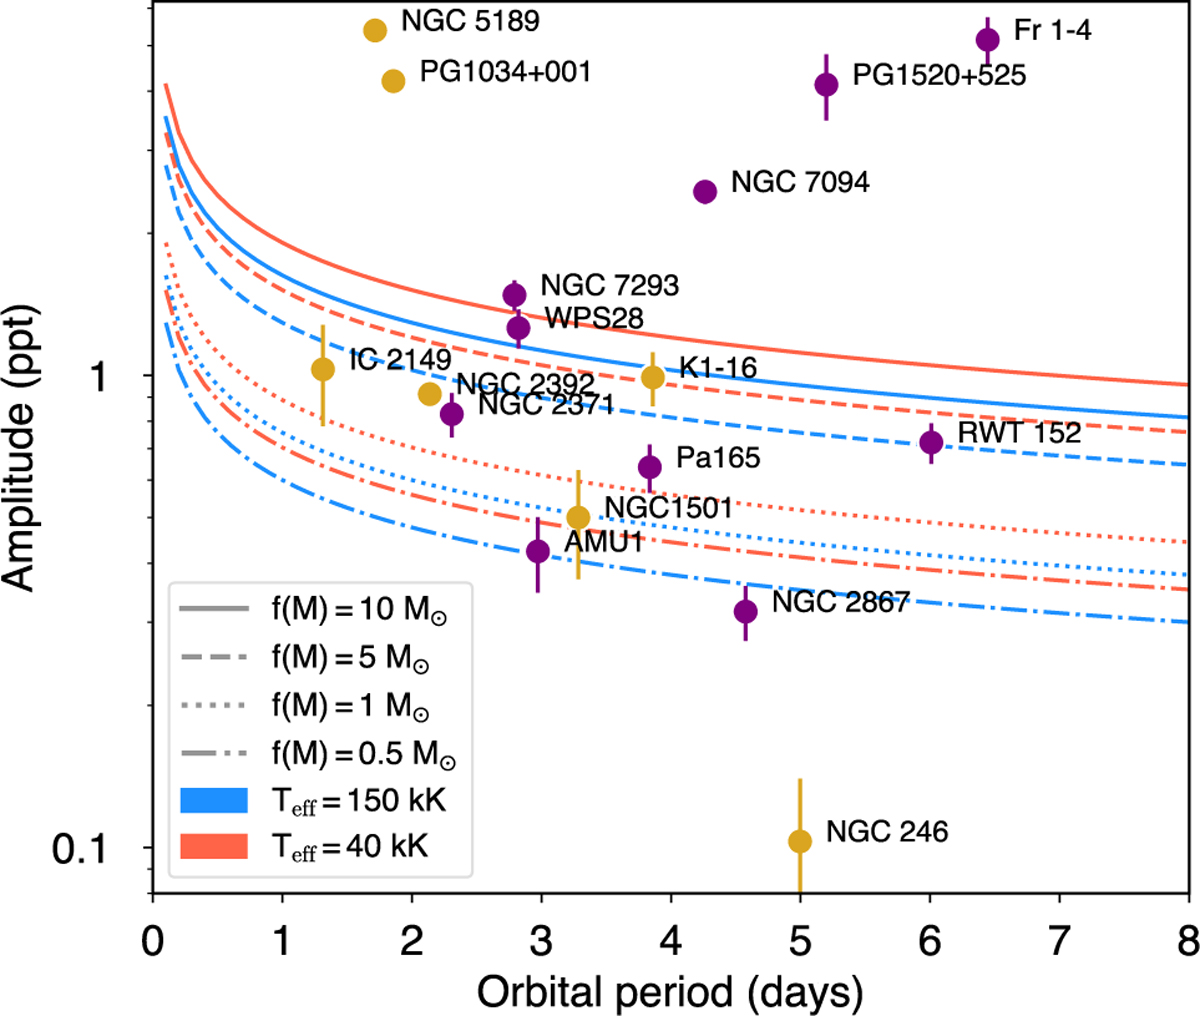
Fig. 10
Download original image
Amplitudes versus orbital periods measured in the TESS light curves. Doppler beaming amplitudes (from the 3E solution) are plotted in gold colour, while A1E (that could be due to irradiation either Doppler beaming), are in purple. Four different mass functions (0.5, 1, 5 and 10 M⊙) for two different effective temperatures (Teff = 40 and 150 kK) have been overplotted to see the position of the stars according to their corresponding effective temperature.
Current usage metrics show cumulative count of Article Views (full-text article views including HTML views, PDF and ePub downloads, according to the available data) and Abstracts Views on Vision4Press platform.
Data correspond to usage on the plateform after 2015. The current usage metrics is available 48-96 hours after online publication and is updated daily on week days.
Initial download of the metrics may take a while.