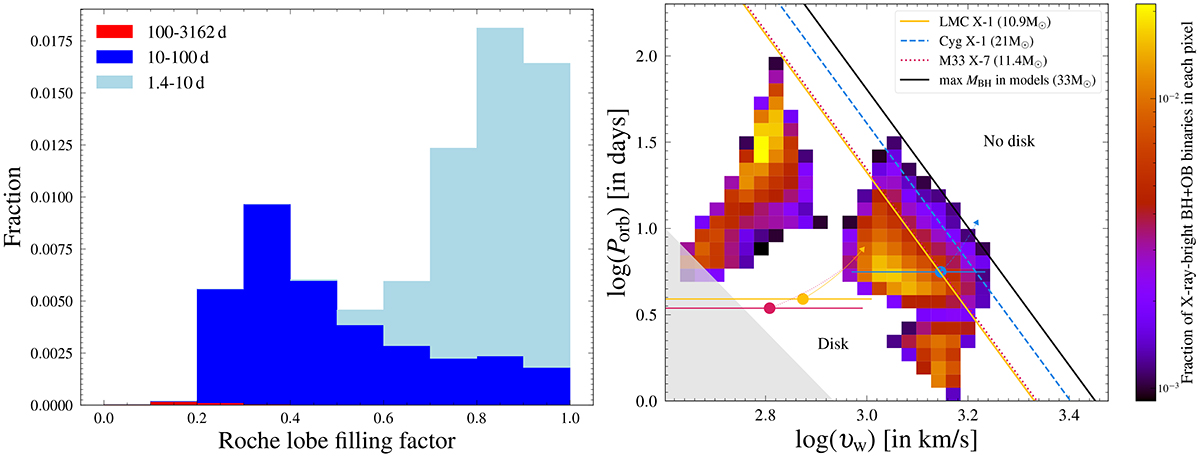
Fig. 3.
Download original image
Observable properties of X-ray-bright systems. Left panel: Distribution of the Roche lobe filling factor of BH+OB star binaries where an accretion disc can form (Sect. 3.2). Light blue, dark blue, and red colours denote the contributions from binary models with different initial orbital period ranges of 1.4–10 d, 10–100 d, and 100–3162 d, respectively. The coloured histograms are stacked on each other, and the sum of their ordinate values is equal to 0.0785 (the fraction of X-ray-bright systems predicted from our entire population of BH+OB star binaries). Right panel: Disc-formation thresholds (Eq. (10) of Sen et al. 2021) shown by slanted solid, dashed, and dotted lines for three BH masses corresponding to the three observed wind-fed BH HMXBs (Orosz et al. 2007, 2009; Miller-Jones et al. 2021; Ramachandran et al. 2022). The black slanted line shows the disc-formation threshold of the maximum BH mass from our binary model grid. An accretion disc can form below the slanted lines and vice versa. The three circles correspond to the observed orbital period and calculated OB star wind speed at the position of the BH (assuming a β-law for the wind velocity profile, with β = 1, Eq. (1) of Sen et al. 2021) of the three BH-hosting wind-fed HMXBs. The horizontal solid lines correspond to the range of wind speed by varying β from 0.5 (upper-speed limit) to 2 (lower limit). The arrows indicate the new position of the square markers if the BH’s orbital period was twice as long. The grey region is where the wind-accretion approximation υw > aΩ is no longer valid. The heatmap shows the distribution of the orbital period of the binary models and wind speed of the OB star companions during the BH+OB star phase when an accretion disc can form. The colour bar gives the predicted fraction of BH HMXBs in each pixel. The sum of the pixels is equal to unity.
Current usage metrics show cumulative count of Article Views (full-text article views including HTML views, PDF and ePub downloads, according to the available data) and Abstracts Views on Vision4Press platform.
Data correspond to usage on the plateform after 2015. The current usage metrics is available 48-96 hours after online publication and is updated daily on week days.
Initial download of the metrics may take a while.