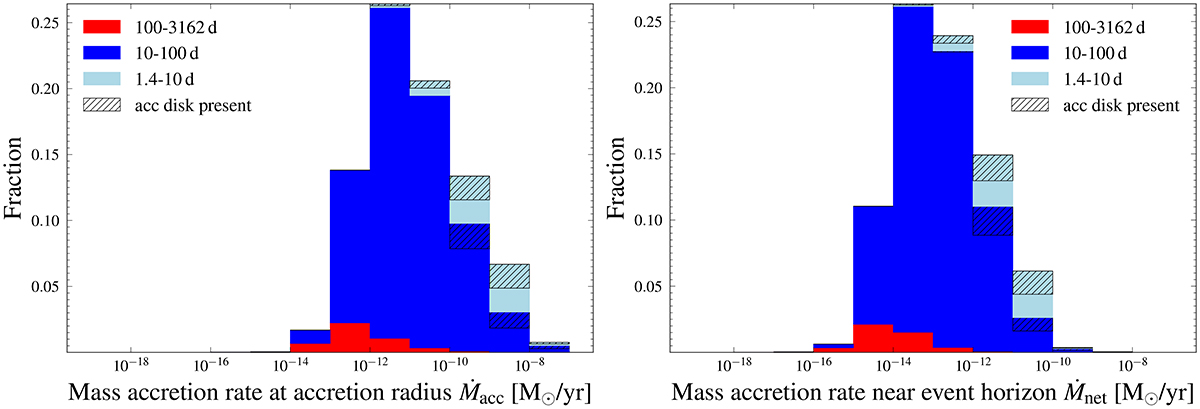
Fig. 1.
Download original image
Distribution of the mass-accretion rate at the accretion radius (Eq. (22), left panel) and the mass-accretion rate at the event horizon of the BH (Eq. (32), right panel), during the BH+OB star phase. The three colours denote the contributions from different initial orbital period ranges. The coloured histograms are stacked on each other, and the sum of the ordinate values equals unity. The black hatching shows the contribution from the BH+OB star binaries where a Keplerian accretion disc can form.
Current usage metrics show cumulative count of Article Views (full-text article views including HTML views, PDF and ePub downloads, according to the available data) and Abstracts Views on Vision4Press platform.
Data correspond to usage on the plateform after 2015. The current usage metrics is available 48-96 hours after online publication and is updated daily on week days.
Initial download of the metrics may take a while.