Fig. D.1.
Download original image
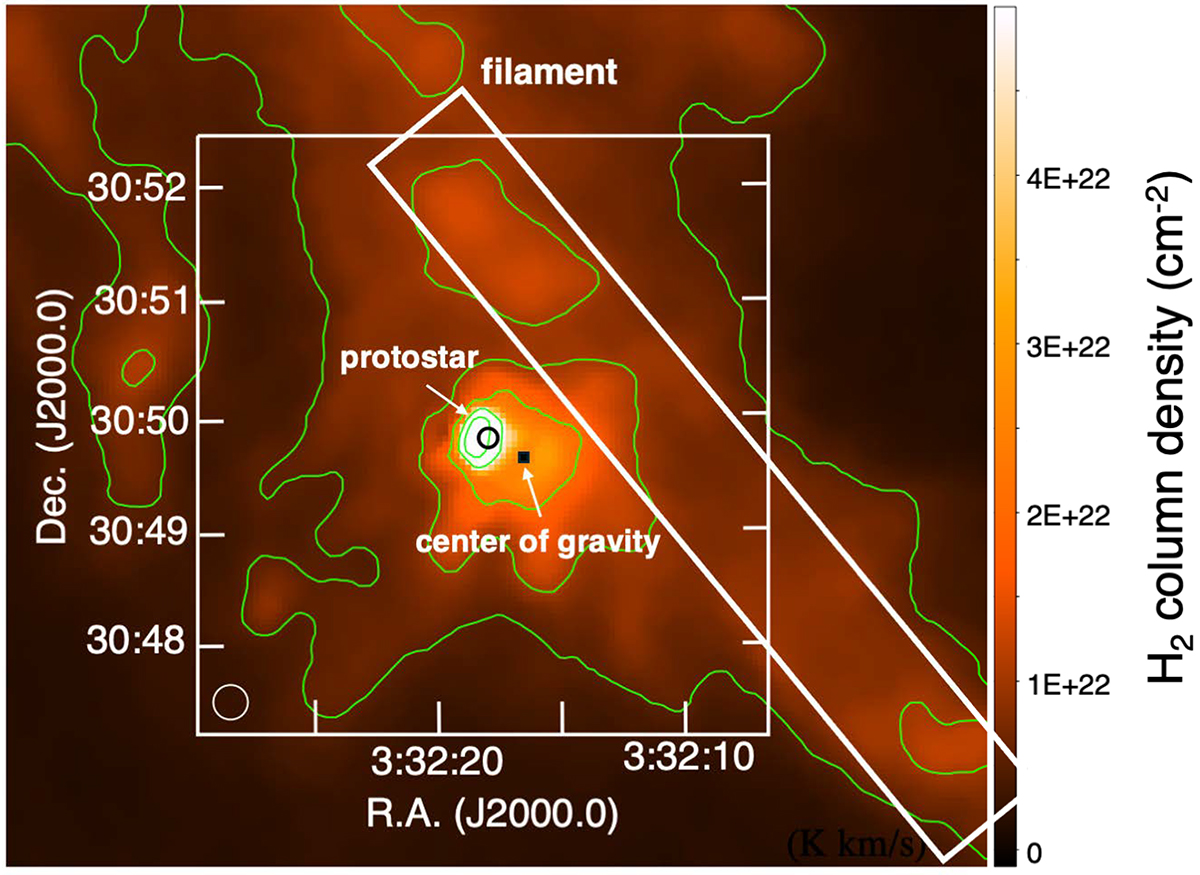
Herschel H2 column density image. The white rectangle indicates the filament that collided with the dense core in our CFC model. The white box with the coordinates is the observation box. The circle at the bottom-left corner represents the beam size of the Herschel map. The small circle near the centre is the position of the protostar. The colour represents the H2 column density in cm−2. The green contours are drawn at the H2 column density levels of 5 ×10²¹, 2 ×10²², 3 ×10²², 5 ×10²², and 1 ×1023 cm−3.
Current usage metrics show cumulative count of Article Views (full-text article views including HTML views, PDF and ePub downloads, according to the available data) and Abstracts Views on Vision4Press platform.
Data correspond to usage on the plateform after 2015. The current usage metrics is available 48-96 hours after online publication and is updated daily on week days.
Initial download of the metrics may take a while.