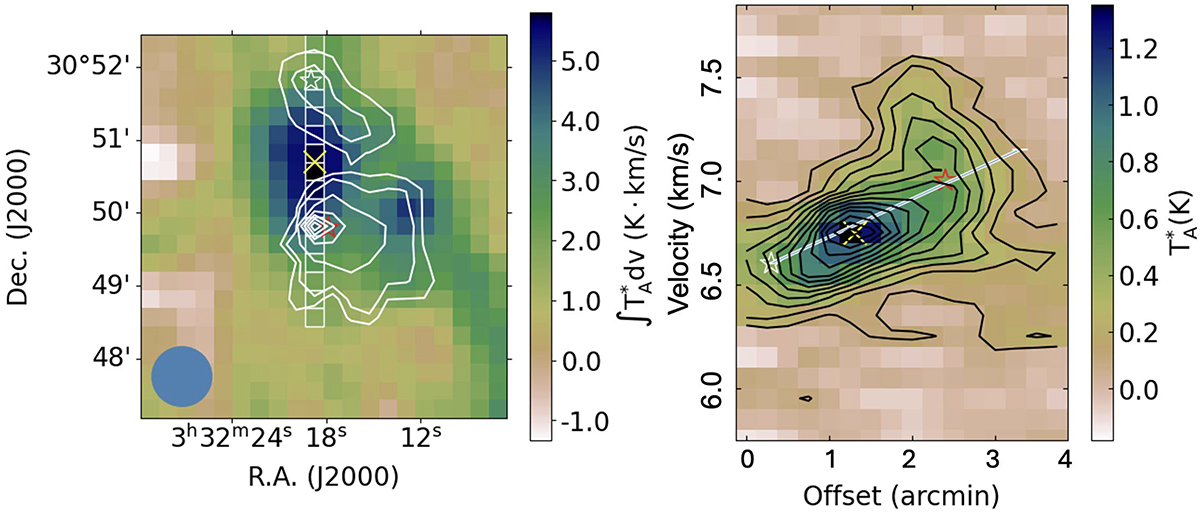
Fig. 3.
Download original image
Velocity structures in Per-emb-2. Left: Integrated-intensity map of CCS (from 6.0 to 8.0 km s−1) in colour overlaid with the Herschel column density map in contours (as in Fig. 1) and the position of the velocity cut along the bridge (in white). Right: Position-velocity plots along the bridge structure from the cut along the bridge seen on the left. White and red stars indicate the positions of starless cores and the protostellar core. The yellow cross indicates the position of the CCS peak. The blue ellipse is the map effective beam size.
Current usage metrics show cumulative count of Article Views (full-text article views including HTML views, PDF and ePub downloads, according to the available data) and Abstracts Views on Vision4Press platform.
Data correspond to usage on the plateform after 2015. The current usage metrics is available 48-96 hours after online publication and is updated daily on week days.
Initial download of the metrics may take a while.