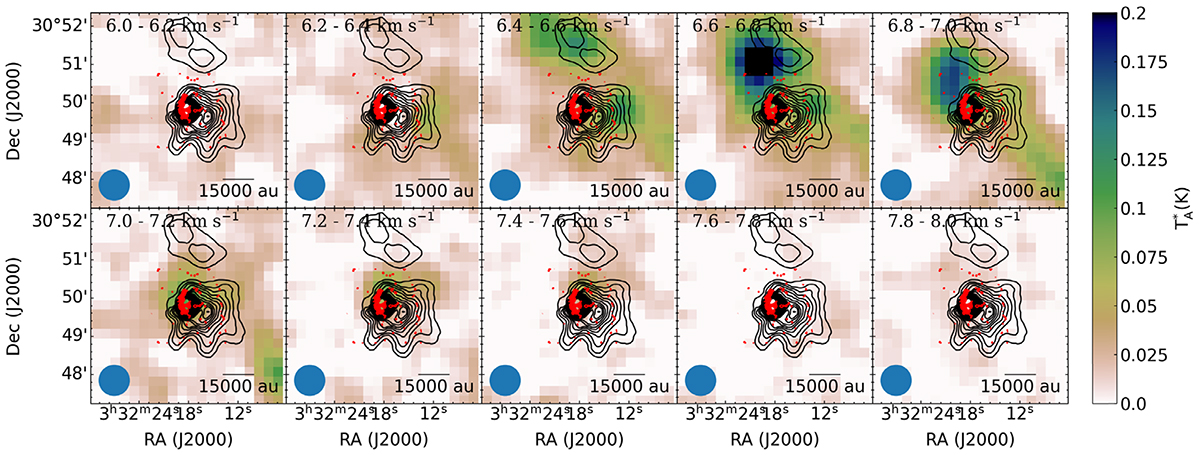
Fig. 2.
Download original image
Colour-scale image showing channel maps of CCS (JN = 43 − 32). The red contours are the CCS (JN = 87 − 76) integrated intensity contours from NOEMA obtained by Pineda et al. (2020). The black contours are Herschel column densities derived by Pezzuto et al. (2021), from 1 × 10²² to 10 × 1022 cm−2 in steps of 0.2 × 1022 cm−2. The blue ellipse is the map effective beam size.
Current usage metrics show cumulative count of Article Views (full-text article views including HTML views, PDF and ePub downloads, according to the available data) and Abstracts Views on Vision4Press platform.
Data correspond to usage on the plateform after 2015. The current usage metrics is available 48-96 hours after online publication and is updated daily on week days.
Initial download of the metrics may take a while.