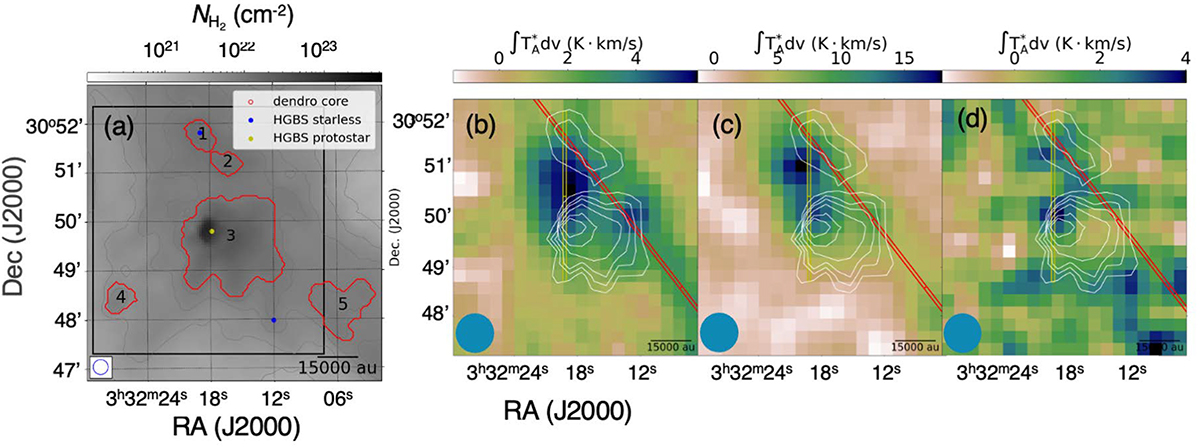
Fig. 1.
Download original image
Overall distributions of molecular gas. Panel (a): Observed area as seen on the Herschel hydrogen molecule column density map. The black box is the 5′ × 5′observation box. The five enclosed red contours indicate the dense cores identified by astrodendro (see Table 1 for the core numbers). The yellow dot located at the centre is the position of the protostar. The blue dots show the positions of the starless cores identified by Pezzuto et al. (2021). Panels (b)–(d): Velocity-integrated maps (from 6.0 to 8.5 km s−1) of CCS (JN = 43 − 32) (b), HC3N (J = 5 − 4) (c), and HC5N (J = 17 − 16) (d) observed with the NRO 45 m telescope. The red lines follow the large-scale filament in this area. The filament is more prominent in a map that covers a larger area (see Fig. D.1). The blue ellipses in panels (b), (c), and (d) are the map effective beam size.
Current usage metrics show cumulative count of Article Views (full-text article views including HTML views, PDF and ePub downloads, according to the available data) and Abstracts Views on Vision4Press platform.
Data correspond to usage on the plateform after 2015. The current usage metrics is available 48-96 hours after online publication and is updated daily on week days.
Initial download of the metrics may take a while.