Open Access
Fig. C.1
Download original image
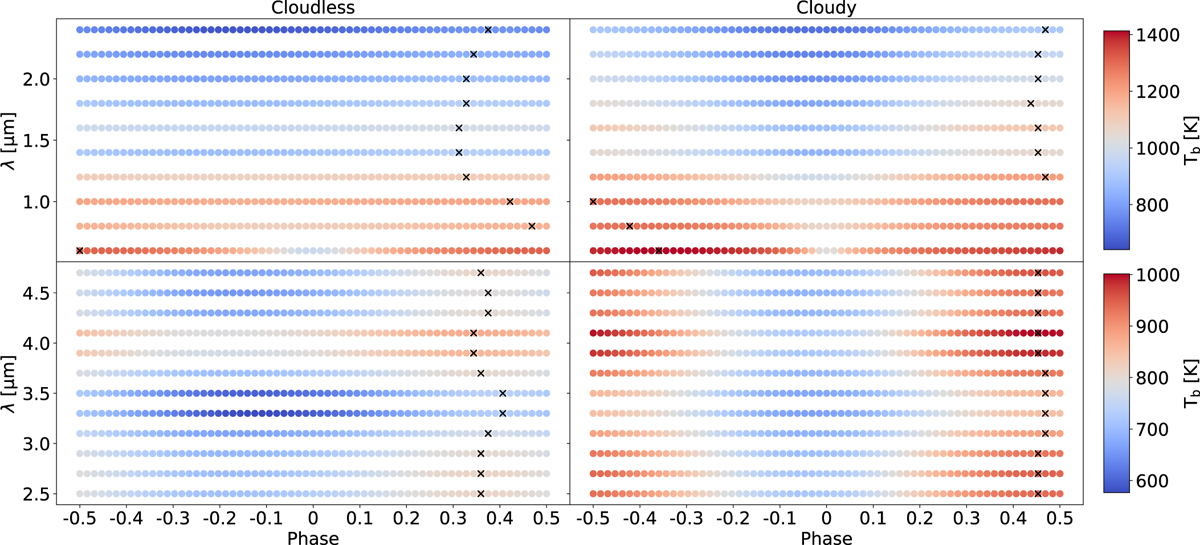
Cloudless (left) and cloudy (right) phase curves on the NIRSpec-PRISM spectral range, converted to planetary brightness temperature. The black crosses indicate the phase of the maximum flux for a given wavelength (i.e. the spectral offsets). Phase 0 corresponds to the night side (i.e. the transit event).
Current usage metrics show cumulative count of Article Views (full-text article views including HTML views, PDF and ePub downloads, according to the available data) and Abstracts Views on Vision4Press platform.
Data correspond to usage on the plateform after 2015. The current usage metrics is available 48-96 hours after online publication and is updated daily on week days.
Initial download of the metrics may take a while.