Fig. B.1
Download original image
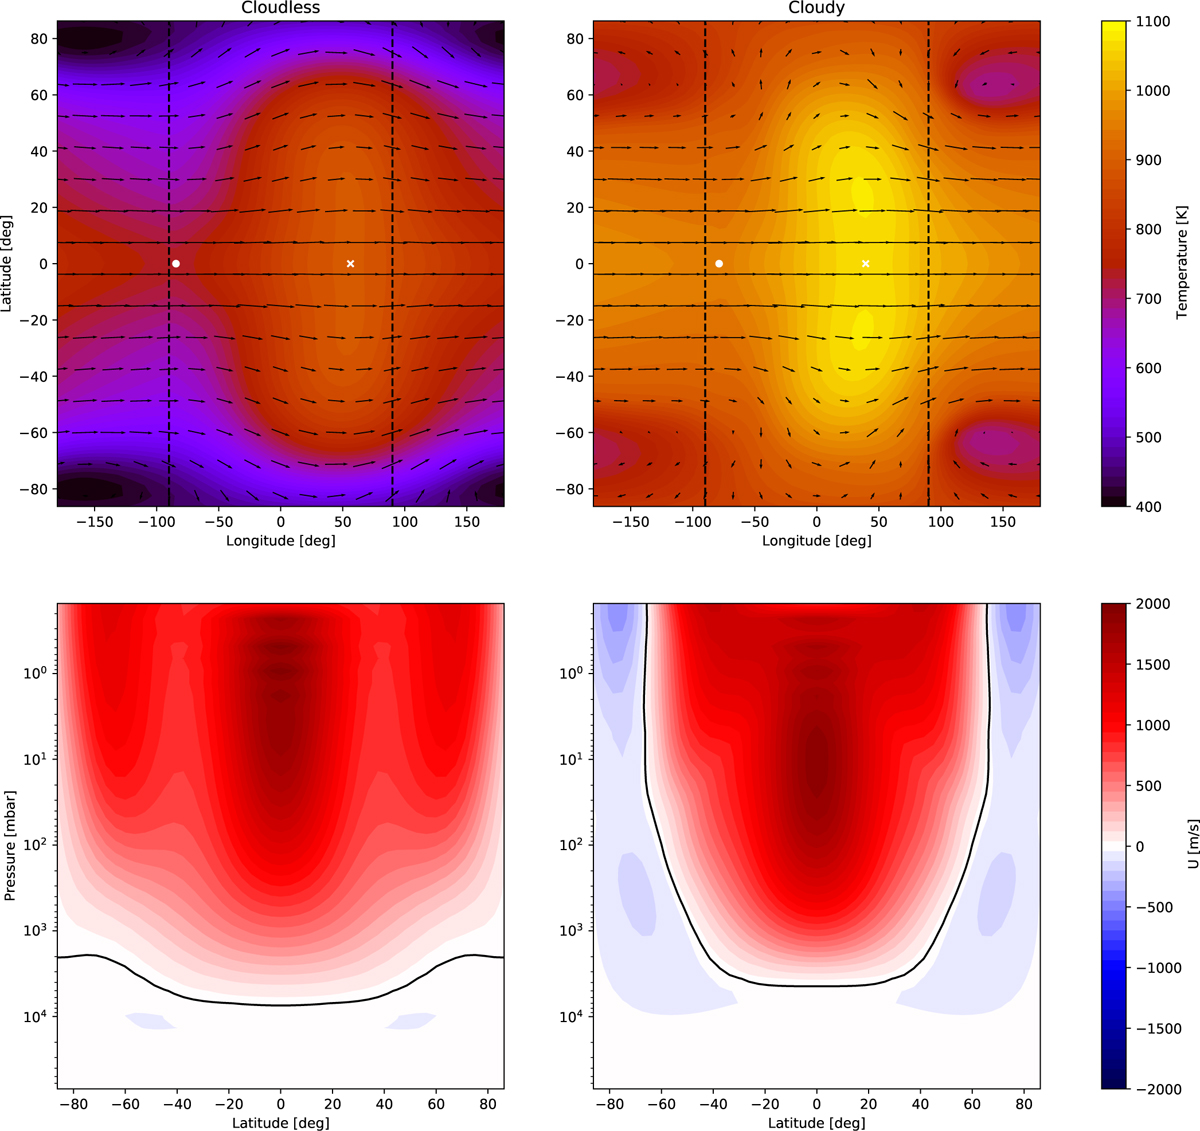
Thermal and wind structure of our cloudless and cloudy simulations of TOI-519 b. Top: longitude-latitude temperature map at a pressure of 25 mbar, averaged in time over the last 100 years. The black arrows represent the wind field, with the size of the arrow proportional to the strength of the wind. The vertical dashed black lines denote the terminators (longitude = ±90°). The white cross and dot represent the equatorial maxima and minima of temperature. Bottom: Zonal mean zonal wind (averaged in time over the last 100 years). The black line denotes the 0 m.s−1 level. The left panels represent the cloudless simulation while the right panels represent the cloudy simulation, including KCl and Na2S clouds.
Current usage metrics show cumulative count of Article Views (full-text article views including HTML views, PDF and ePub downloads, according to the available data) and Abstracts Views on Vision4Press platform.
Data correspond to usage on the plateform after 2015. The current usage metrics is available 48-96 hours after online publication and is updated daily on week days.
Initial download of the metrics may take a while.