Fig. 9
Download original image
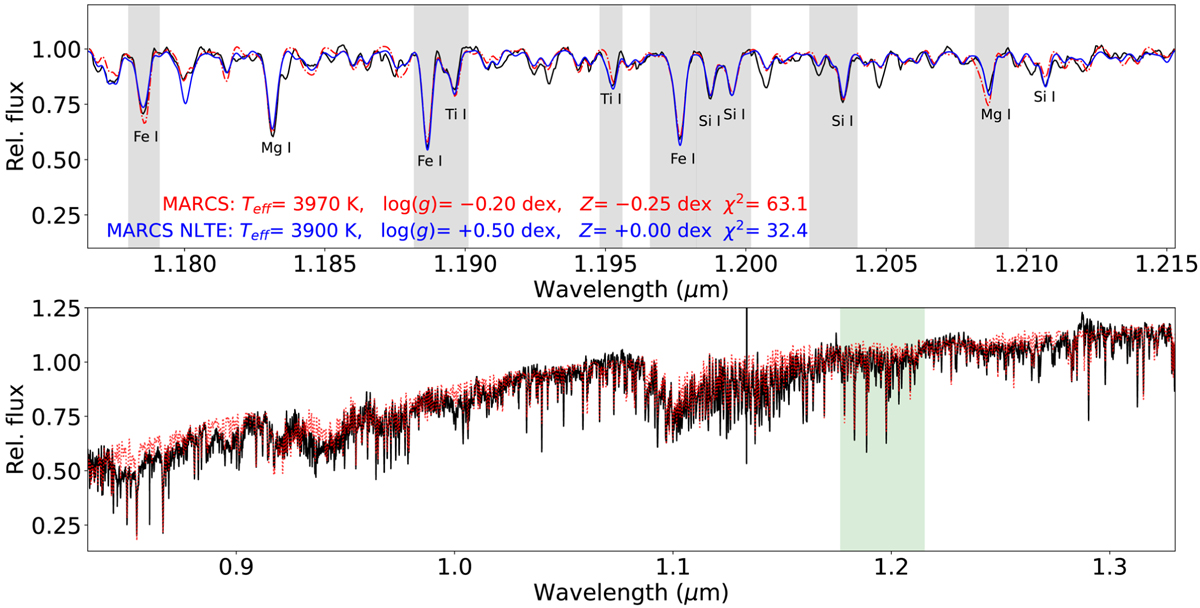
Derived parameters from the FIRE spectrum. Top: best fit of the FIRE spectrum (solid black) in the J-band for the LTE MARCS models (dashed-dot red) and the NLTE-corrected version (solid blue) with the NLTE effects applied to the indicated lines. The spectral regions used in the fitting are shown with gray shades. Bottom: best LTE MARCS model (dotted red) from the J-band to the FIRE spectrum (black). The model was reddened with E(B − V) = 1.05 mag to match the SED. The green-shaded region highlights the spectral region shown in the upper plot.
Current usage metrics show cumulative count of Article Views (full-text article views including HTML views, PDF and ePub downloads, according to the available data) and Abstracts Views on Vision4Press platform.
Data correspond to usage on the plateform after 2015. The current usage metrics is available 48-96 hours after online publication and is updated daily on week days.
Initial download of the metrics may take a while.