Open Access
Fig. 3
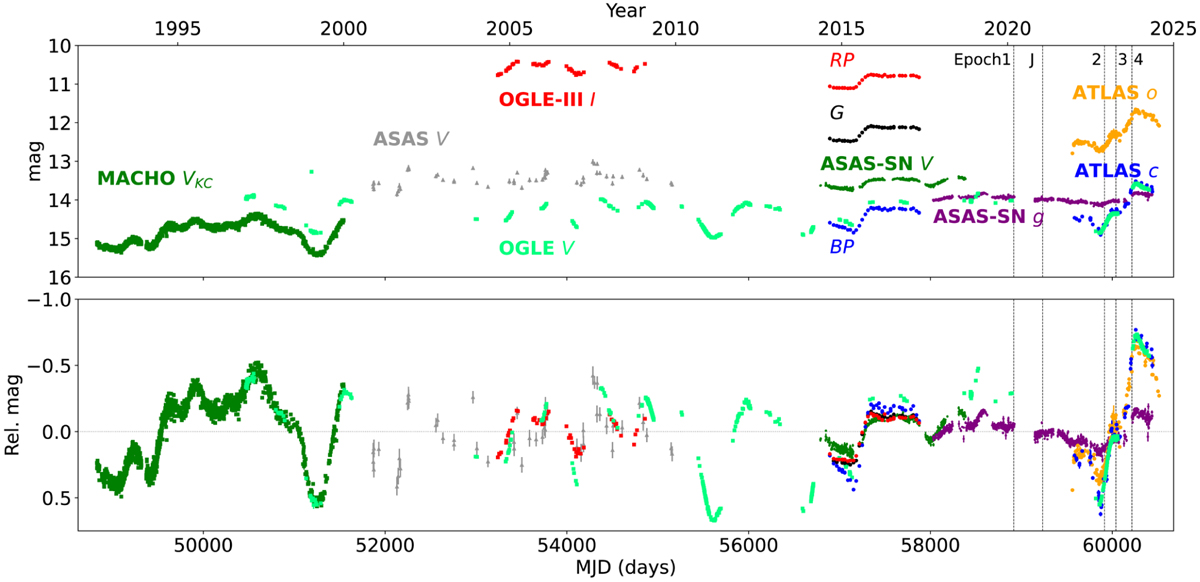
Download original image
Light curve of [W60] B90 indicating the respective survey and filter. Top: magnitudes obtained from each survey. Bottom: relative magnitude after subtracting the mean value of each data set. The vertical lines represent the epoch-spectroscopy as labeled in Table 1.
Current usage metrics show cumulative count of Article Views (full-text article views including HTML views, PDF and ePub downloads, according to the available data) and Abstracts Views on Vision4Press platform.
Data correspond to usage on the plateform after 2015. The current usage metrics is available 48-96 hours after online publication and is updated daily on week days.
Initial download of the metrics may take a while.