Open Access
Fig. 10
Download original image
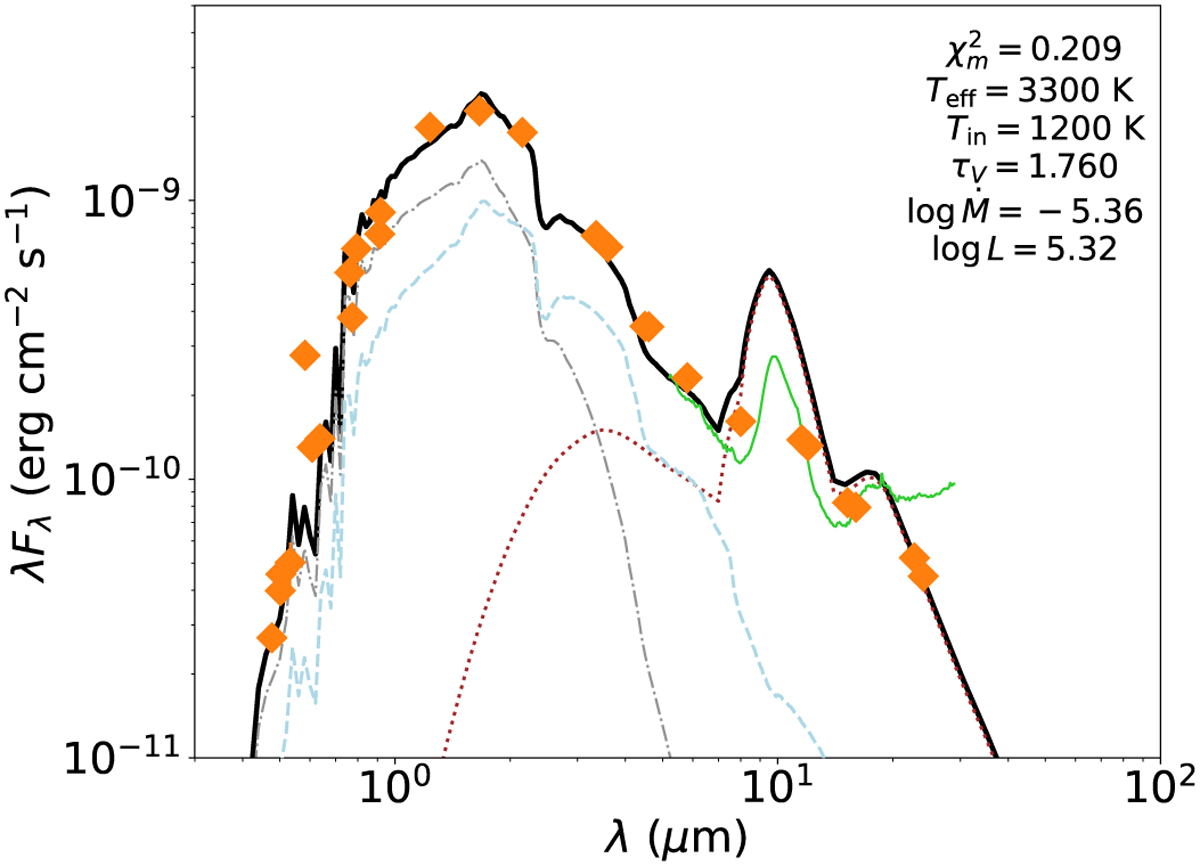
SED of [W60] B90. The orange diamonds show the observations and the black line is the best-fit model from DUSTY, which is a superposition of attenuated flux (dashed light blue), the scattered flux (dot-dashed gray), and dust emission (dotted brown). The green curve represents the Spitzer IRS spectrum.
Current usage metrics show cumulative count of Article Views (full-text article views including HTML views, PDF and ePub downloads, according to the available data) and Abstracts Views on Vision4Press platform.
Data correspond to usage on the plateform after 2015. The current usage metrics is available 48-96 hours after online publication and is updated daily on week days.
Initial download of the metrics may take a while.