Fig. 1
Download original image
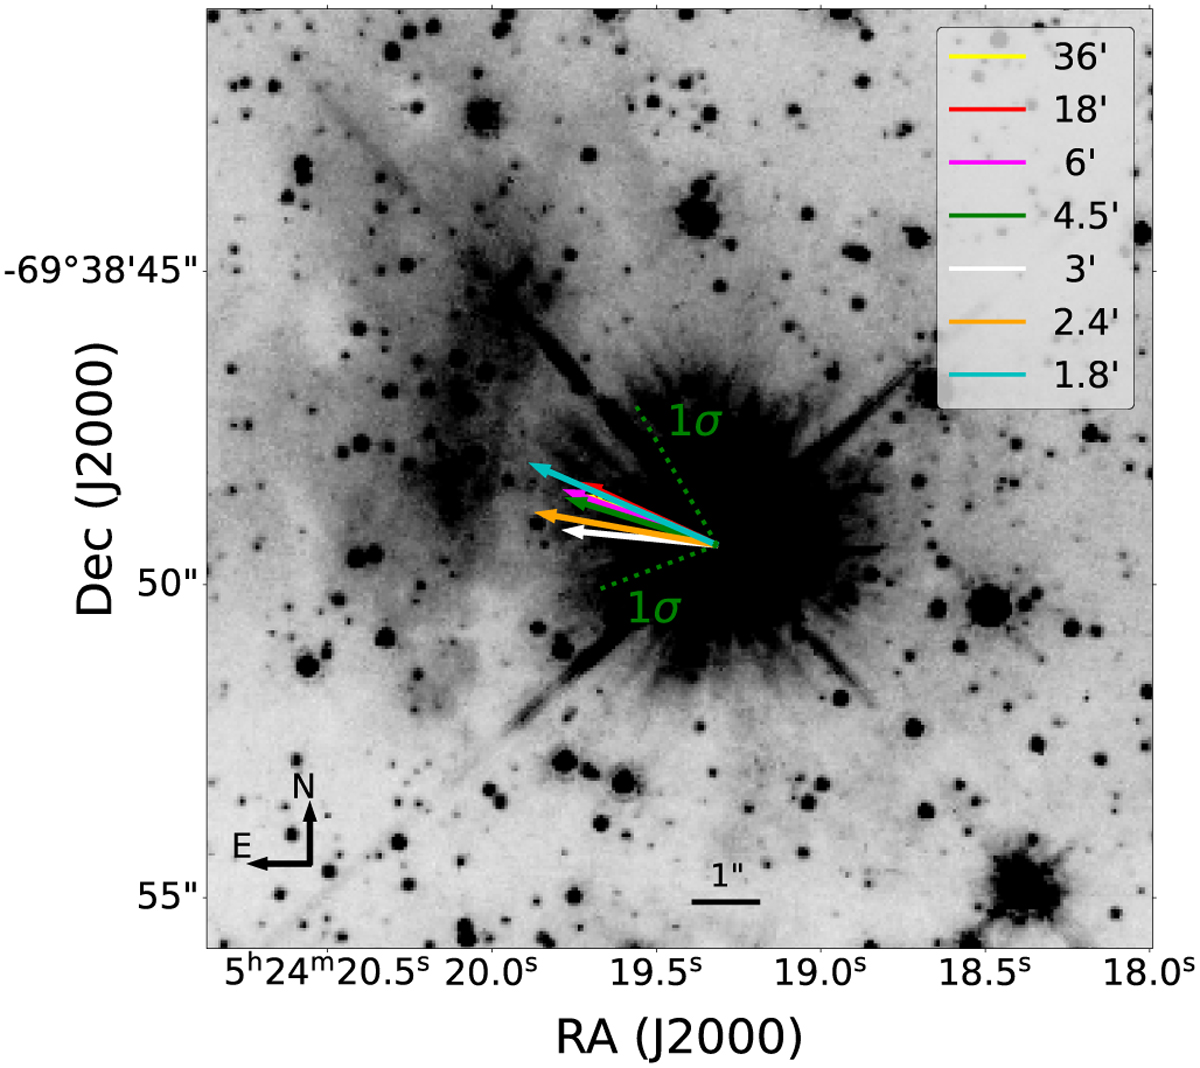
HST F675W image of [W60] B90 showing the PM analysis for PLMC = 0.7. The arrows represent the peculiar velocity direction of [W60] B90 for each cone to compute the local PM of the LMC. The length of the arrows is scaled with the peculiar velocity. The green dotted lines show the 1σ PM error from Gaia DR3 on the 4.5′ cone size.
Current usage metrics show cumulative count of Article Views (full-text article views including HTML views, PDF and ePub downloads, according to the available data) and Abstracts Views on Vision4Press platform.
Data correspond to usage on the plateform after 2015. The current usage metrics is available 48-96 hours after online publication and is updated daily on week days.
Initial download of the metrics may take a while.