Fig. 3
Download original image
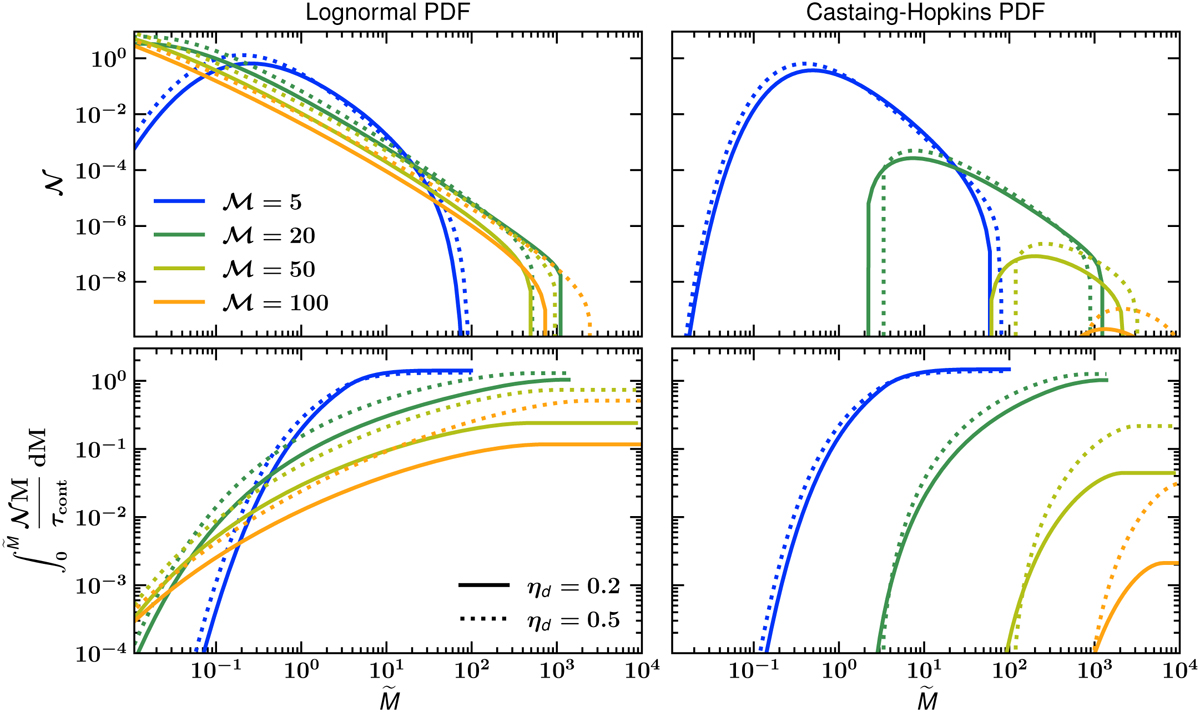
Mass spectra for various Mach numbers and PDF. Top: mass spectrum of self-gravitating structures. Bottom: time-weigthed cumulative mass spectrum of self-gravitating structures. Both quantities are plotted for a series of Mach numbers from ℳ = 5 (blue) to ℳ = 100 (orange), and for ηd = 0.2 (solid lines) and ηd = 0.5 (dotted lines). The models in the left column make use of the log-normal PDF while the ones in the right column use the Castaing-Hopkins PDF. For all curves, the compressibility parameter b is 0.67, the injection scale, Li, is assumed to be 200 pc and the mean density n0 is 1.5 cm−3.
Current usage metrics show cumulative count of Article Views (full-text article views including HTML views, PDF and ePub downloads, according to the available data) and Abstracts Views on Vision4Press platform.
Data correspond to usage on the plateform after 2015. The current usage metrics is available 48-96 hours after online publication and is updated daily on week days.
Initial download of the metrics may take a while.