Fig. 6.
Download original image
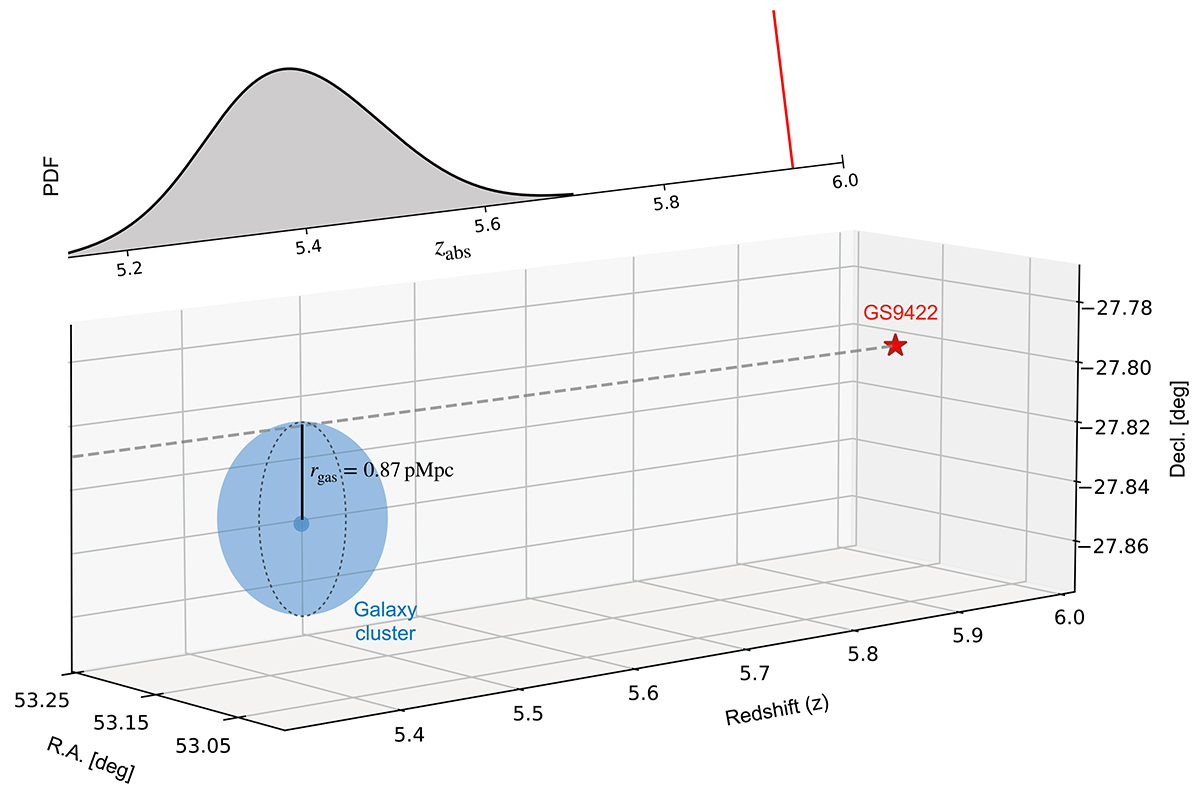
3D illustration of the proposed scenario with GS9244 at z = 5.943 being in the background of a galaxy-cluster overdensity at z = 5.4. The estimated center and mean redshift of the cluster is marked by the small blue dot (Helton et al. 2023), and the blue sphere with radius r = 0.87 pMpc shows the impact parameter to the galaxy sight line. The smoothed probability density function from the MCMC analysis (Fig. A.2) is shown at the top, distributed around the cluster redshift with median z = 5.4.
Current usage metrics show cumulative count of Article Views (full-text article views including HTML views, PDF and ePub downloads, according to the available data) and Abstracts Views on Vision4Press platform.
Data correspond to usage on the plateform after 2015. The current usage metrics is available 48-96 hours after online publication and is updated daily on week days.
Initial download of the metrics may take a while.