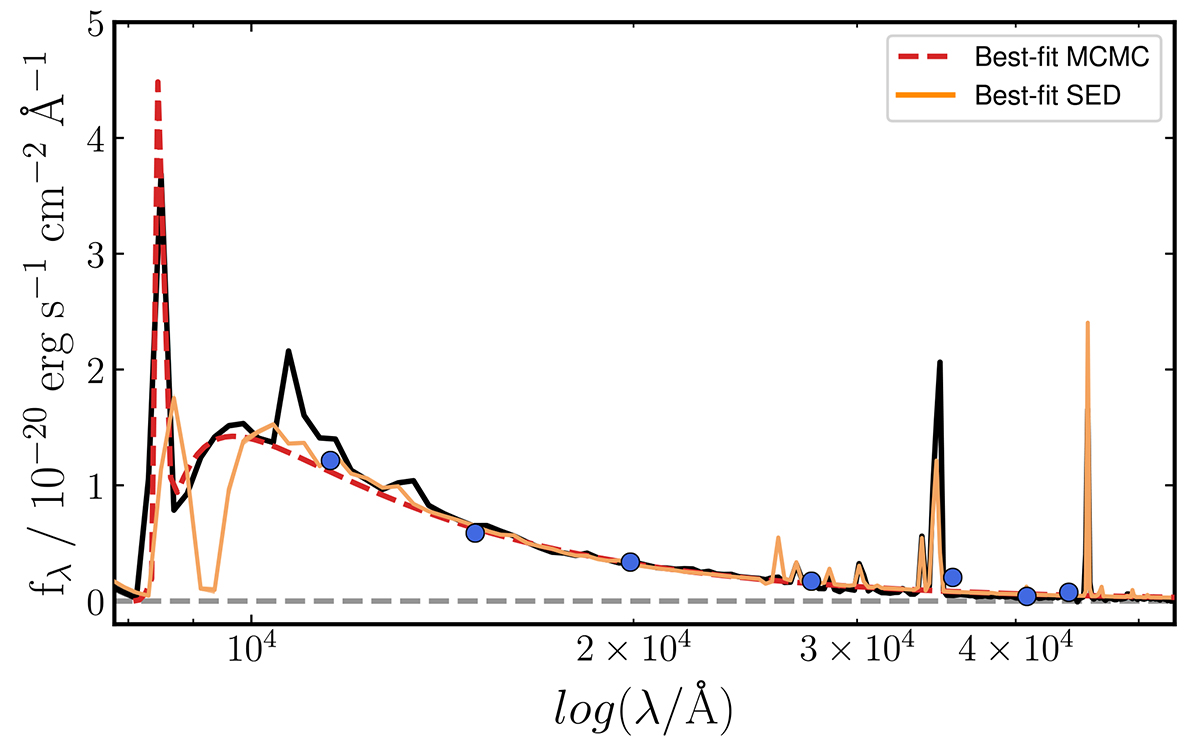
Fig. 5.
Download original image
Best-fit spectrophotometric SED and Lyα model of the JWST data. The black solid curve shows the JWST/NIRSpec Prism spectrum and the dark blue dots the corresponding JWST/NIRCam photometry. The best-fit SED model from BAGPIPES is shown as the orange curve, here modified to include the DLA, with zabs as a free parameter. The best-fit MCMC stellar continuum and Lyα model is shown as the red dashed line, with a best-fit Lyα emission line redshift consistent with zspec but zabs = 5.396 ± 0.098.
Current usage metrics show cumulative count of Article Views (full-text article views including HTML views, PDF and ePub downloads, according to the available data) and Abstracts Views on Vision4Press platform.
Data correspond to usage on the plateform after 2015. The current usage metrics is available 48-96 hours after online publication and is updated daily on week days.
Initial download of the metrics may take a while.