Fig. 2.
Download original image
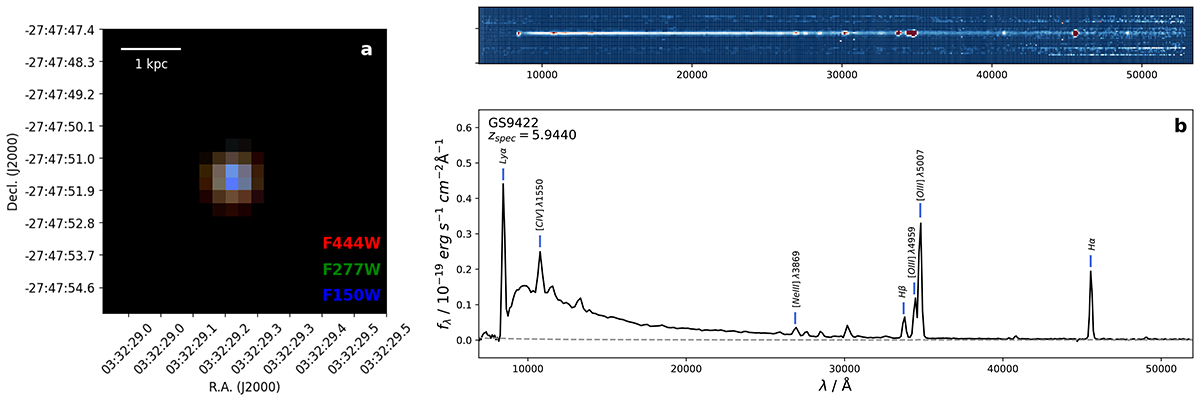
False-RGB plot (a) and NIRSpec spectrum of GS9422 (b). (a) False-RGB-plot zoomed in on GS9422 based on the JWST/NIRCam filters: F444W (red), F277W (green), and F150W (blue). Physical scale is calculated in the source plane. (b) JWST/NIRSpec Prism spectrum with the most prominent nebular and auroral emission lines marked. Top panel shows the 2D trace spectrum.
Current usage metrics show cumulative count of Article Views (full-text article views including HTML views, PDF and ePub downloads, according to the available data) and Abstracts Views on Vision4Press platform.
Data correspond to usage on the plateform after 2015. The current usage metrics is available 48-96 hours after online publication and is updated daily on week days.
Initial download of the metrics may take a while.