Fig. 32
Download original image
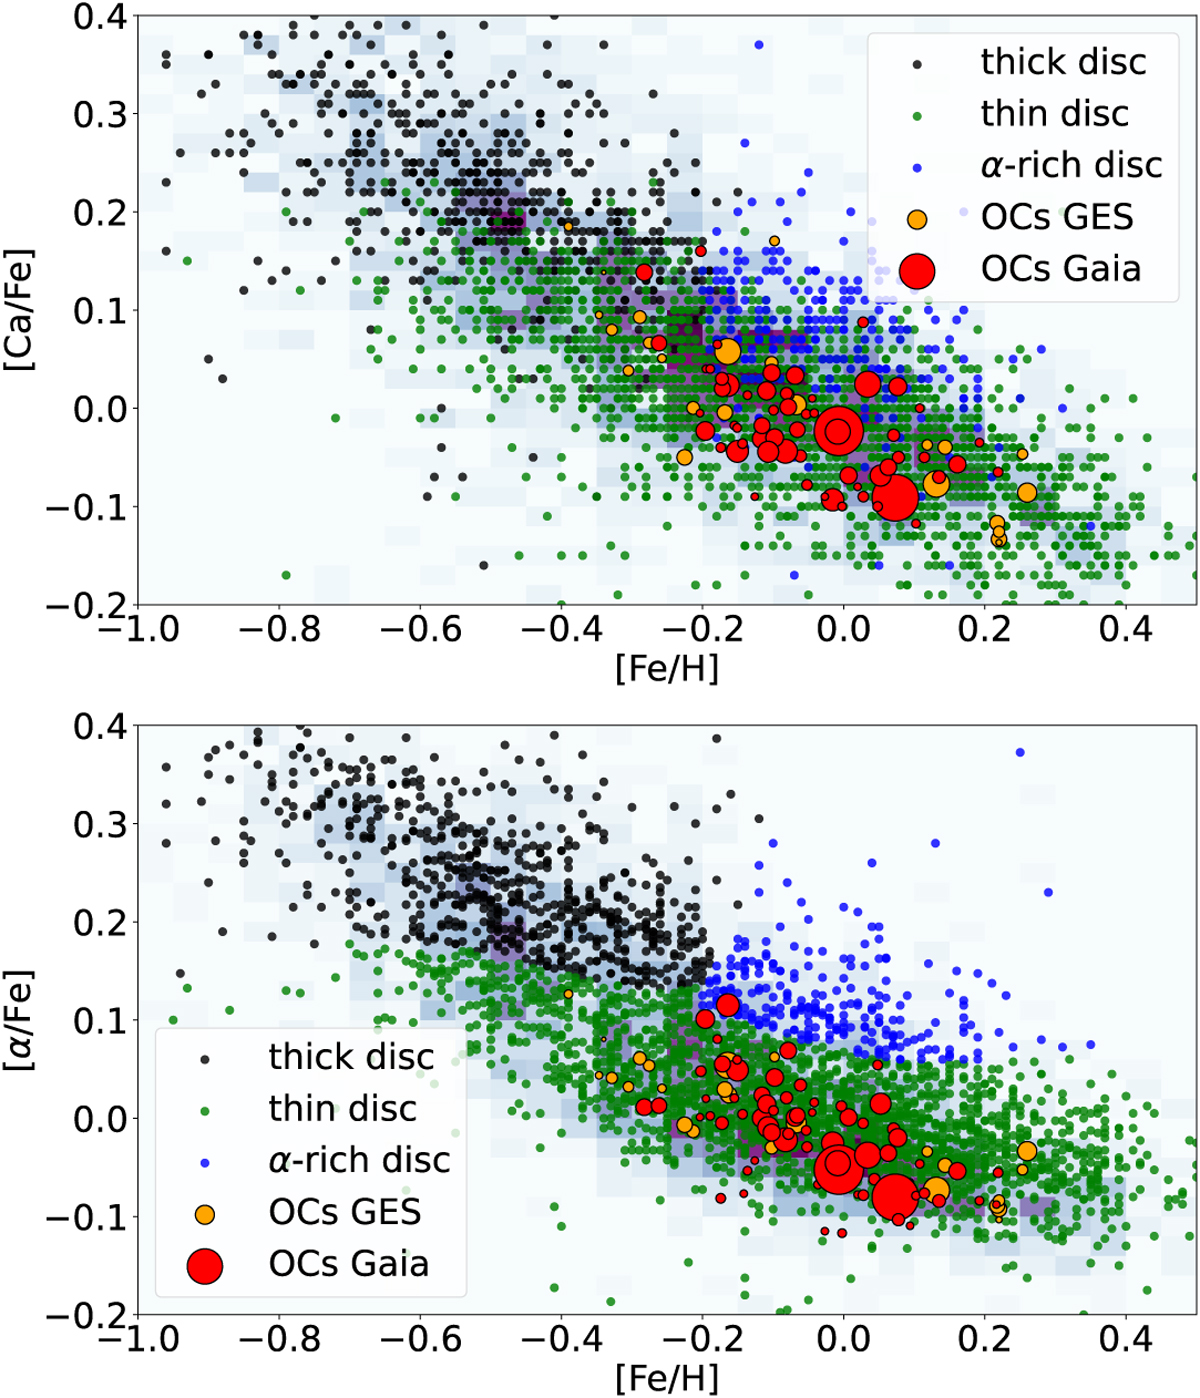
Gaia and GES clusters in the [Ca/Fe] vs. [M/H] (upper panel) and in the [α/Fe] vs. [M/H] (lower panel) planes. In the background (light blue 2D histogram with rectangular cells), we show the abundances of the field stars observed by GES. In black, we show the thick disc population; in green, the thin disc one; in blue, the high-α discs. The open clusters observed by GES are represented by orange circles and those observed by Gaia by red circles. In both cases the radius of the circles is proportional to the number of members.
Current usage metrics show cumulative count of Article Views (full-text article views including HTML views, PDF and ePub downloads, according to the available data) and Abstracts Views on Vision4Press platform.
Data correspond to usage on the plateform after 2015. The current usage metrics is available 48-96 hours after online publication and is updated daily on week days.
Initial download of the metrics may take a while.