Open Access
Fig. 26
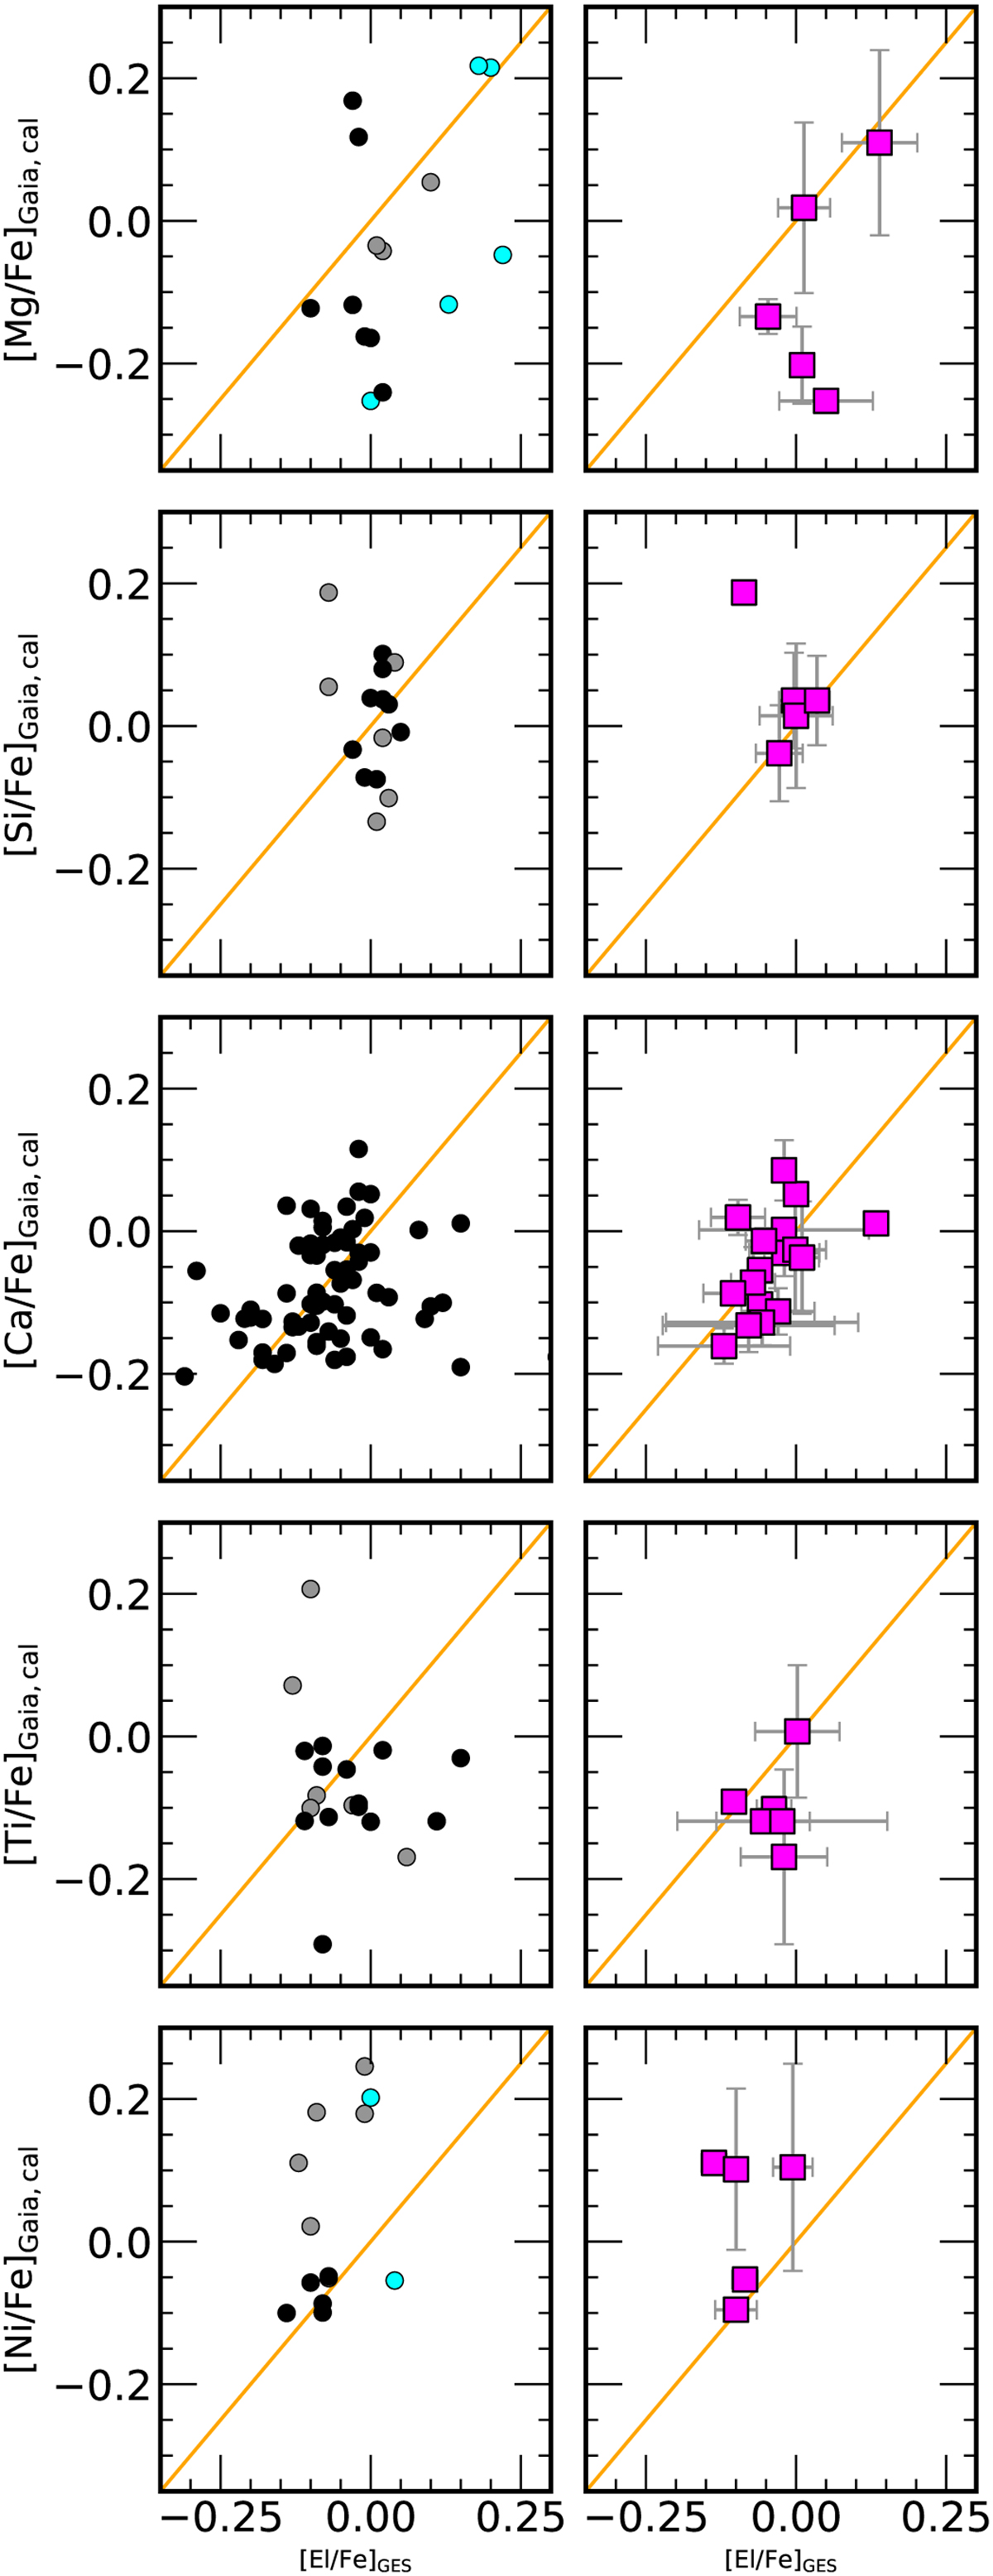
Download original image
Calibrated abundance ratios [X/Fe] from Gaia versus those from Gaia-ESO for individual members of open clusters in common (left) and their average abundance ratios (right). Each symbol represents a single member star coloured according to its quality flag (black: 0, grey: 1, cyan:2).
Current usage metrics show cumulative count of Article Views (full-text article views including HTML views, PDF and ePub downloads, according to the available data) and Abstracts Views on Vision4Press platform.
Data correspond to usage on the plateform after 2015. The current usage metrics is available 48-96 hours after online publication and is updated daily on week days.
Initial download of the metrics may take a while.