Fig. B.1.
Download original image
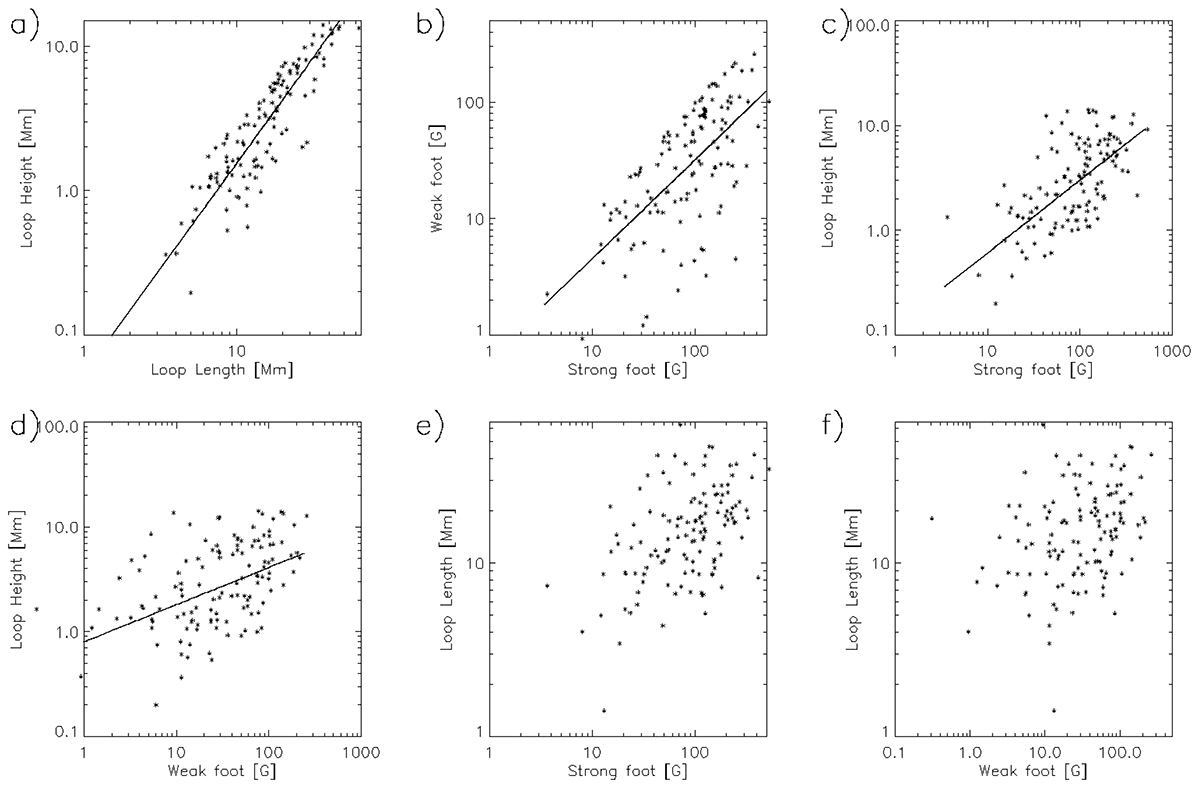
Scatter plots of some statistical properties for 126 loops. (a) Loop length vs. loop height (Pearson correlation cP= 0.90), (b) Magnetic field strength in the strong vs. weak footpoint of magnetic loop (cP= 0.60), (c) Stronger magnetic field footpoint vs loop height (cP= 0.46), (d) Weaker magnetic field footpoint vs. loop height (cP= 0.45), (e) Stronger magnetic field footpoint vs. loop length (cP= 0.34), and (f) Weaker magnetic field footpoint vs. loop length (cP= 0.31).
Current usage metrics show cumulative count of Article Views (full-text article views including HTML views, PDF and ePub downloads, according to the available data) and Abstracts Views on Vision4Press platform.
Data correspond to usage on the plateform after 2015. The current usage metrics is available 48-96 hours after online publication and is updated daily on week days.
Initial download of the metrics may take a while.