Fig. 4.
Download original image
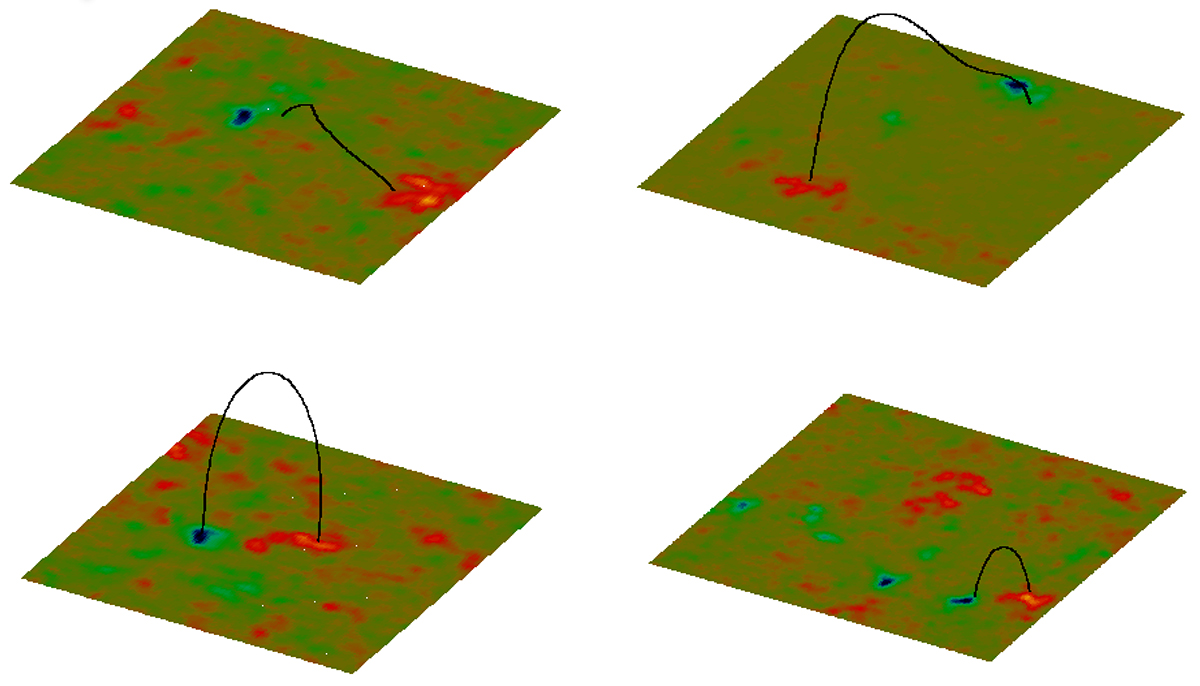
Four examples of 3D loop views. The best-computed field lines are shown in black lines that match the observed AIA 193 loops. The observed magnetograms are shown at the bottom of the 3D plots with green/red colours for negative/positive Bz values, respectively. Top row: HMI magnetogram of cases 1 and 72 shown in Fig. 2. Bottom row: same for cases 4 and 6 shown in Fig. 3.
Current usage metrics show cumulative count of Article Views (full-text article views including HTML views, PDF and ePub downloads, according to the available data) and Abstracts Views on Vision4Press platform.
Data correspond to usage on the plateform after 2015. The current usage metrics is available 48-96 hours after online publication and is updated daily on week days.
Initial download of the metrics may take a while.