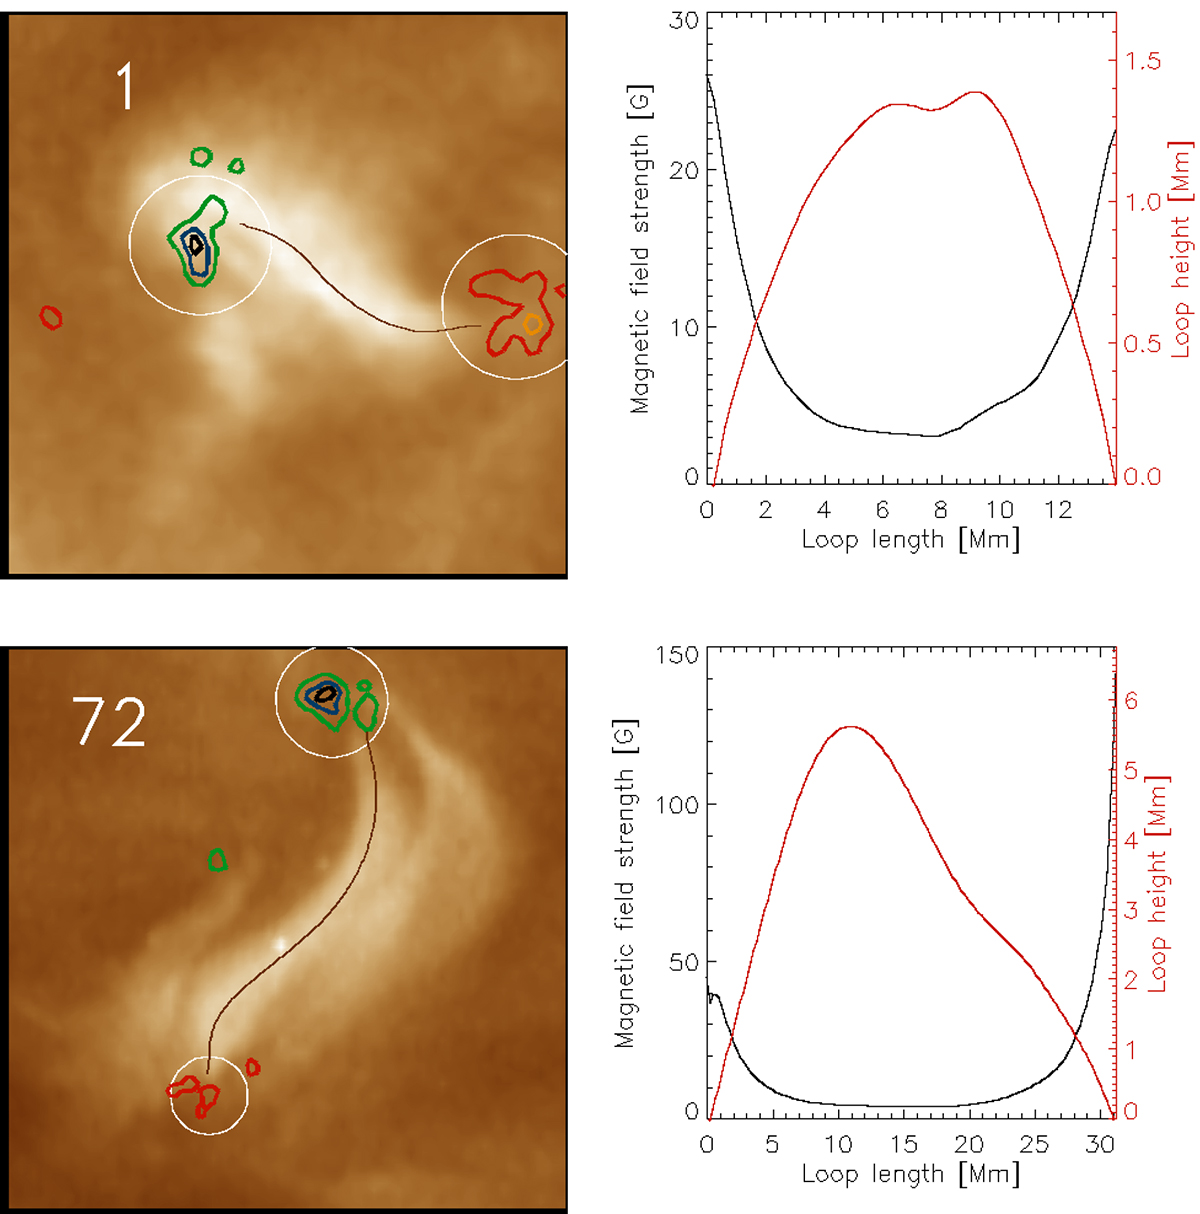
Fig. 2.
Download original image
Two examples of loops fitted with the fully (standard) automatic algorithm (cases 1 and 72). Left: AIA 193 intensity with the best field line (black line) fitted a loop. The circles mark the potential footpoint areas as automatically selected by the algorithm. Only closed magnetic field lines with footpoints in these circled areas are considered for the fitting procedure. The three black and green contours indicate negative polarities. The three orange and red contours outline positive polarities. All contours are relative to the absolute maximum field strength in the magnetograms, equispaced between 0 and max |Bz|. The intensity of each image is scaled to the maximum intensity of the image. Right: black curve shows the magnetic field strength along the loop length as obtained from the LMHS model. The red curve gives the loop height along its length.
Current usage metrics show cumulative count of Article Views (full-text article views including HTML views, PDF and ePub downloads, according to the available data) and Abstracts Views on Vision4Press platform.
Data correspond to usage on the plateform after 2015. The current usage metrics is available 48-96 hours after online publication and is updated daily on week days.
Initial download of the metrics may take a while.