Fig. 15
Download original image
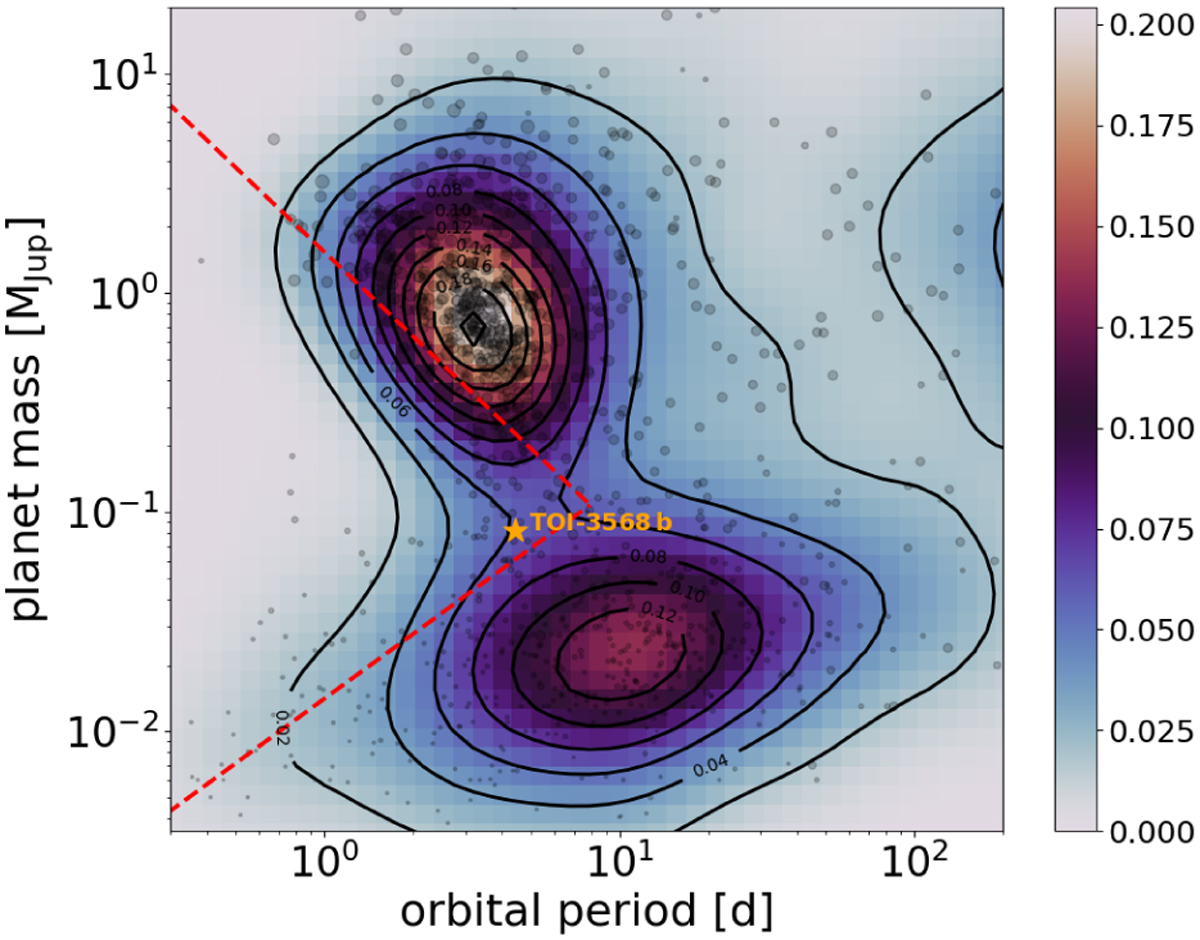
Mass–period diagram. The gray circles show the exoplanet data from exoplanet.eu, where the size of the circles is proportional to the planetary radius. The color map depicts the planet-detection rate as a percentage normalized to the sum of all known exoplanets in the mass range between 0.003 MJup and 20 MJup and orbital periods between 0.3 d and 200 d. The red dashed lines show the innermost limits of the sub-Jovian desert as defined by Mazeh et al. (2016). The orange star shows TOI-3568 b, which lies within the desert right in the transition between the two populations of the most frequent types of exoplanets, hot-Jupiters (top), and warm super-Earths (bottom).
Current usage metrics show cumulative count of Article Views (full-text article views including HTML views, PDF and ePub downloads, according to the available data) and Abstracts Views on Vision4Press platform.
Data correspond to usage on the plateform after 2015. The current usage metrics is available 48-96 hours after online publication and is updated daily on week days.
Initial download of the metrics may take a while.