Fig. 14
Download original image
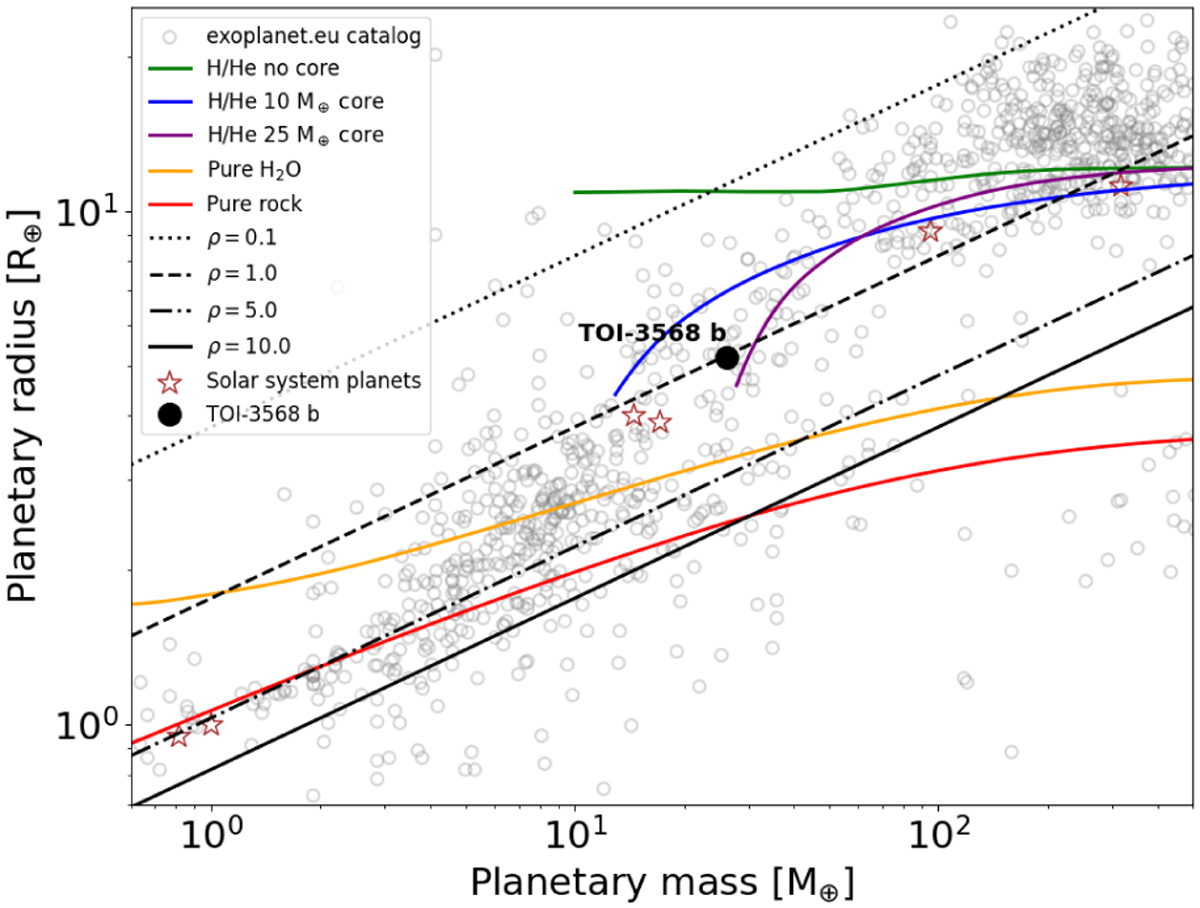
Mass–radius diagram. The gray circles show the exoplanet data from exoplanets.eu and the red stars show the Solar System planets. The black point corresponds to the measured value for TOI- 3568 b. Internal structure models for planets with pure rock and pure ice (H2O) compositions from Zeng et al. (2019) are depicted by the solid red and orange lines, respectively. Additionally, evolutionary models for H/He-dominated planets from Fortney et al. (2007) are shown for a pure H/He without a core (green line), and for a core of 10 M⊕ (blue line) and 25 M⊕ (purple line) of heavier elements. Iso-density curves are also represented by the black lines.
Current usage metrics show cumulative count of Article Views (full-text article views including HTML views, PDF and ePub downloads, according to the available data) and Abstracts Views on Vision4Press platform.
Data correspond to usage on the plateform after 2015. The current usage metrics is available 48-96 hours after online publication and is updated daily on week days.
Initial download of the metrics may take a while.