Fig. 10
Download original image
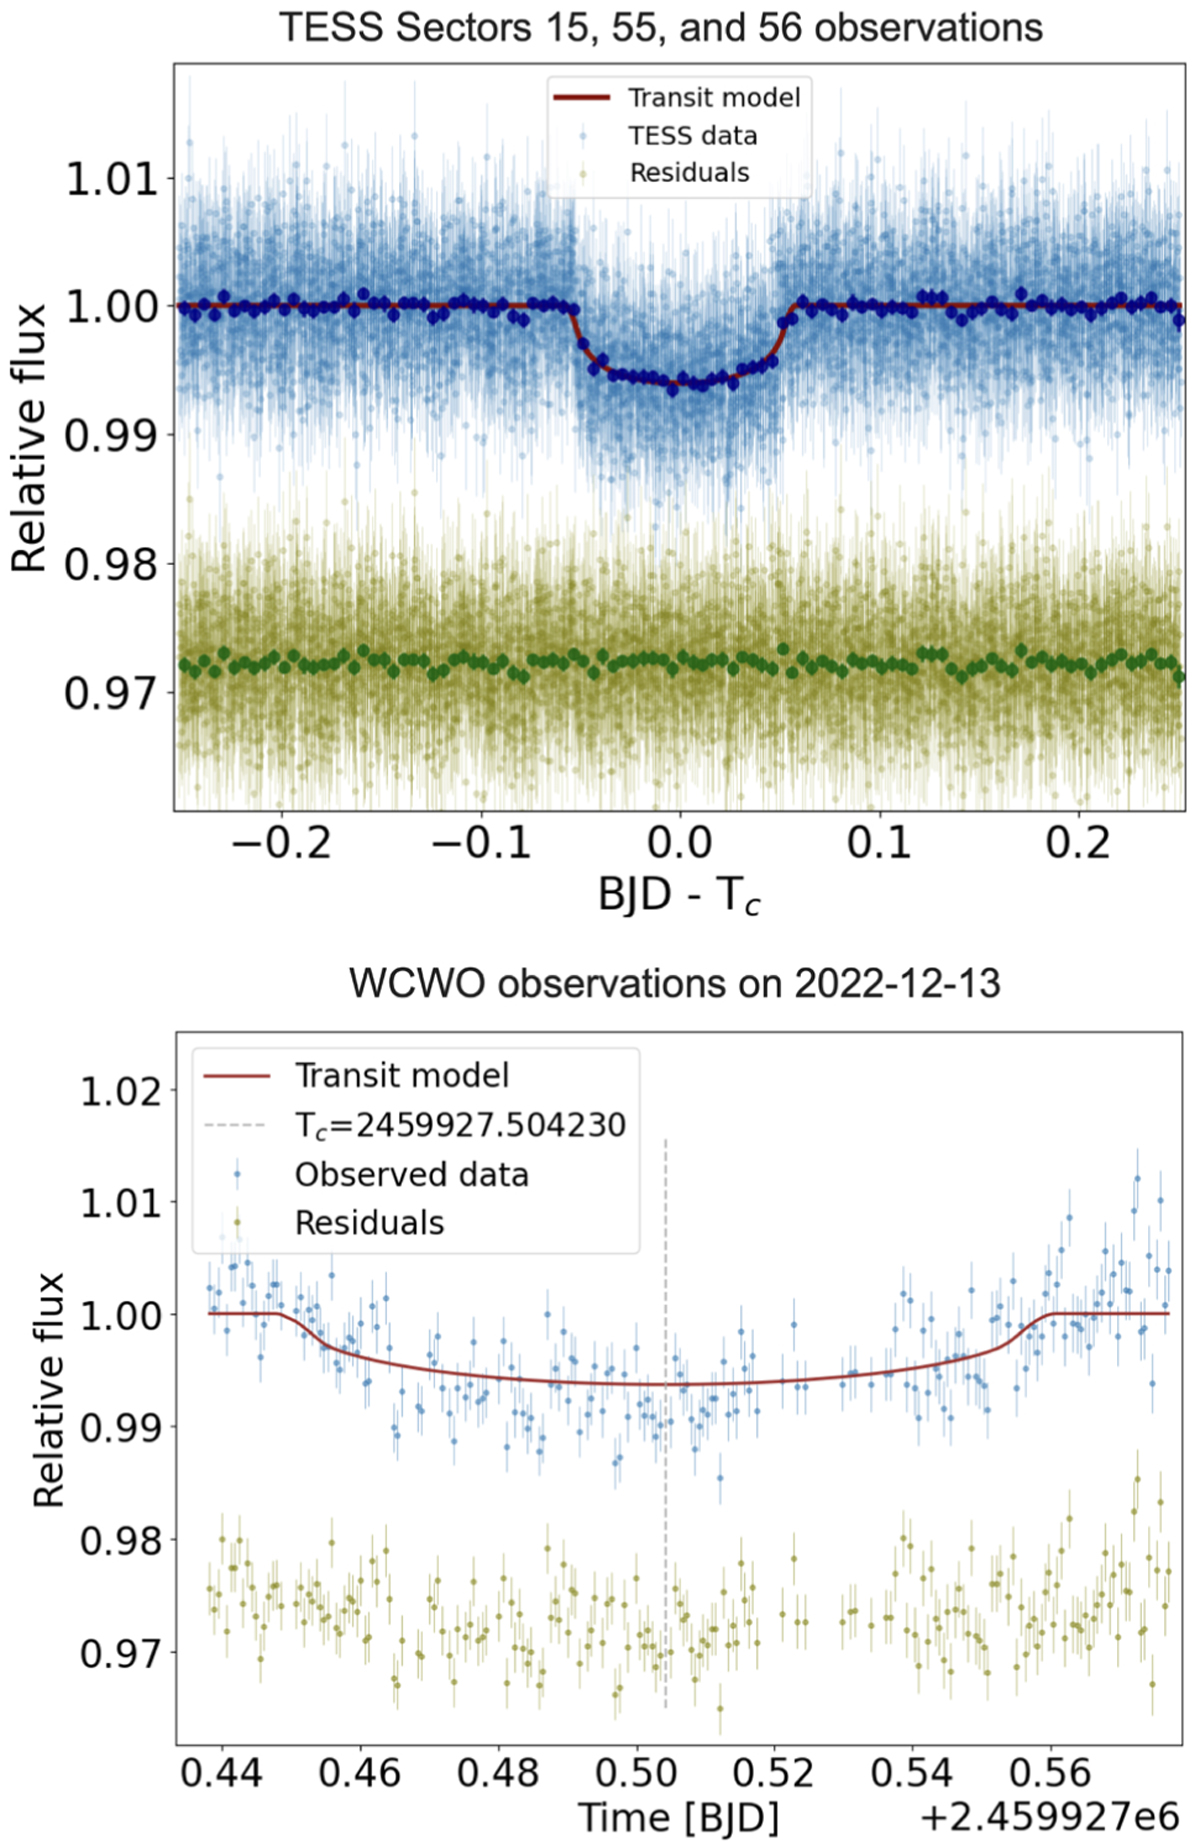
Photometric observations of the transits of TOI-3568 b. The top panel shows the 19 transits observed by TESS, while the bottom panel exhibits the single transit observed by our ground-based follow-up using the 0.7 m telescope at the Wellesley College Whitin Observatory. The light blue points show the photometry data around the transits of TOI- 3568 b, with the times in the top panel being relative to the central time of each transit. The red lines show the best-fit transit model and the green points show the residuals plus an arbitrary offset for better visualization. The dark blue and green points in the top panel represent the weighted averages of bins with a size of 0.01 d.
Current usage metrics show cumulative count of Article Views (full-text article views including HTML views, PDF and ePub downloads, according to the available data) and Abstracts Views on Vision4Press platform.
Data correspond to usage on the plateform after 2015. The current usage metrics is available 48-96 hours after online publication and is updated daily on week days.
Initial download of the metrics may take a while.