Fig. 2
Download original image
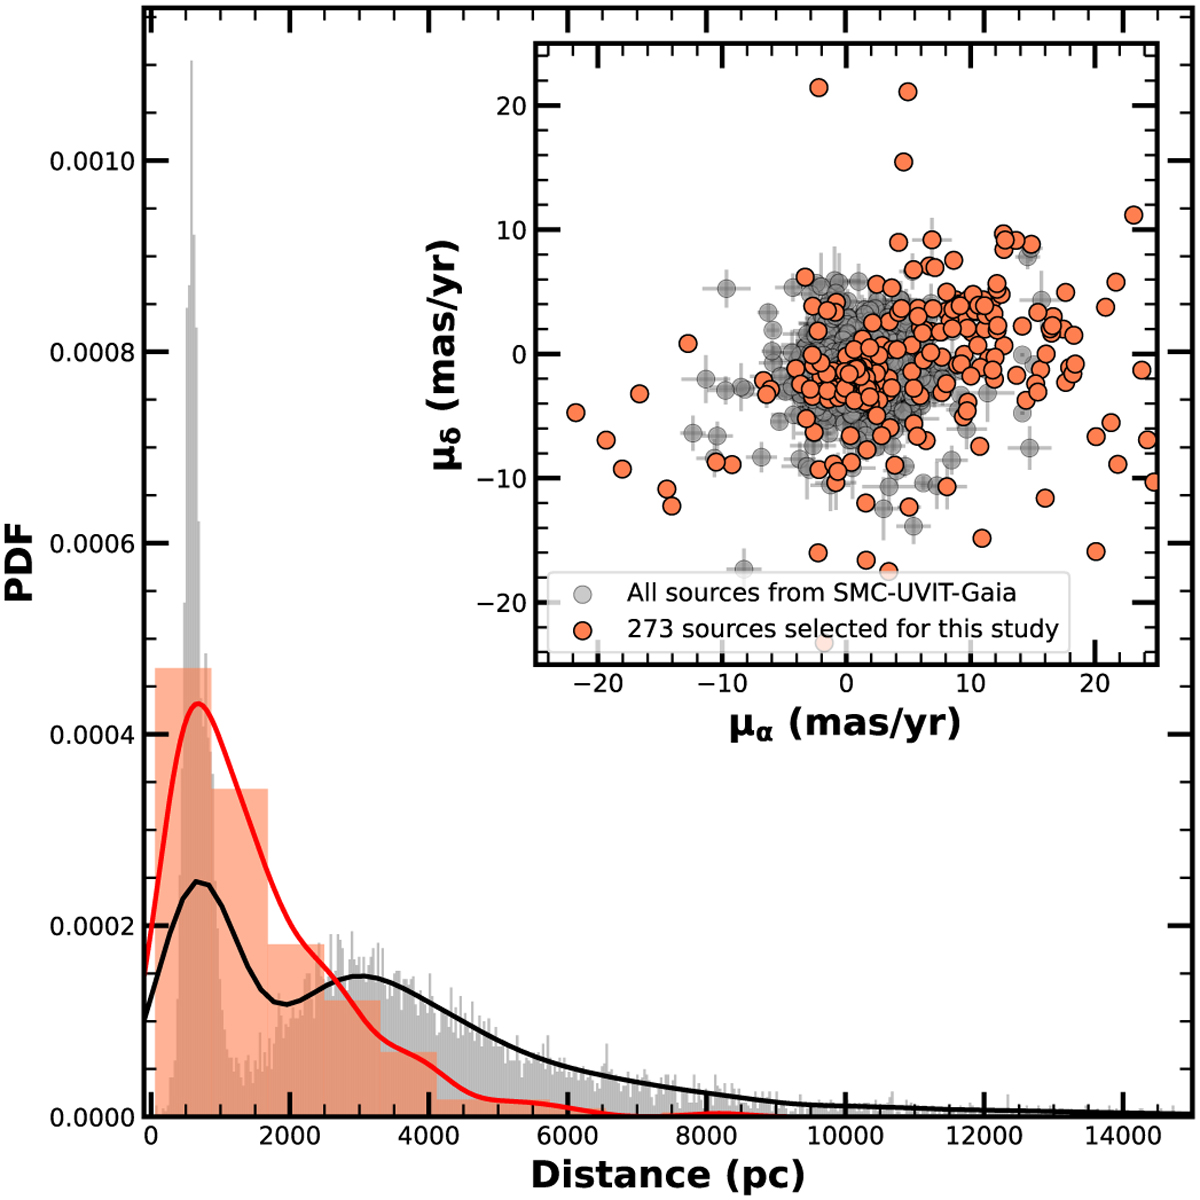
Gaia DR3 distance (Bailer-Jones et al. 2021) distribution plot of the 273 sources used in this study. The 273 sources used in this study are shown in orange, and the 10 847 sources in the SMC-UVIT-Gaia are shown as grey markers. The kernel density estimates of the distributions are overlaid for better visual representation. The red and black lines show the kernel density estimates of the 273 sources and SMC-UVIT-Gaia sources, respectively. In the inset we show a scatter plot with error bars of the proper motion in RA (mas/yr) vs. proper motion in Dec (mas/yr). For most sources, the error bars have the size of the markers.
Current usage metrics show cumulative count of Article Views (full-text article views including HTML views, PDF and ePub downloads, according to the available data) and Abstracts Views on Vision4Press platform.
Data correspond to usage on the plateform after 2015. The current usage metrics is available 48-96 hours after online publication and is updated daily on week days.
Initial download of the metrics may take a while.