Open Access
Fig. A.1.
Download original image
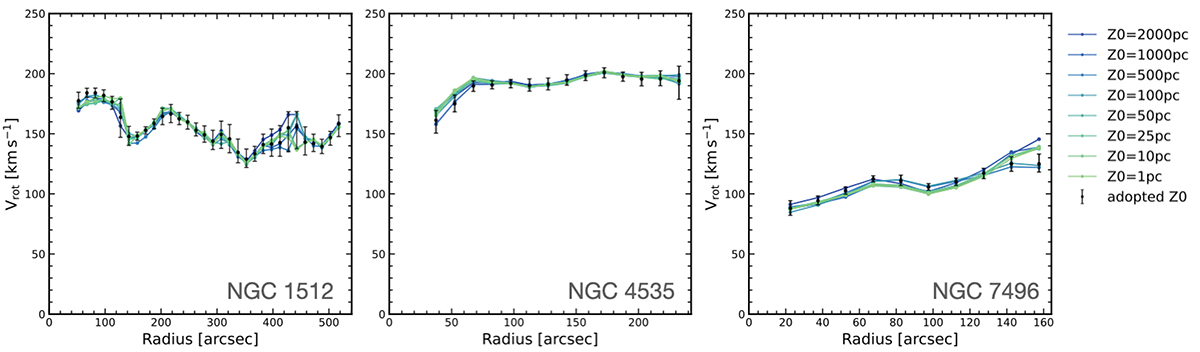
Fitting results achieved for varying constant values of scale height for 9 different values for NGC 1512 (left), NGC 4535 (middle), and NGC 7496 (right). The scale height was chosen from unrealistically small (green) to unrealistically large (blue) values. The final rotation curve adopted in this paper is plotted in black.
Current usage metrics show cumulative count of Article Views (full-text article views including HTML views, PDF and ePub downloads, according to the available data) and Abstracts Views on Vision4Press platform.
Data correspond to usage on the plateform after 2015. The current usage metrics is available 48-96 hours after online publication and is updated daily on week days.
Initial download of the metrics may take a while.