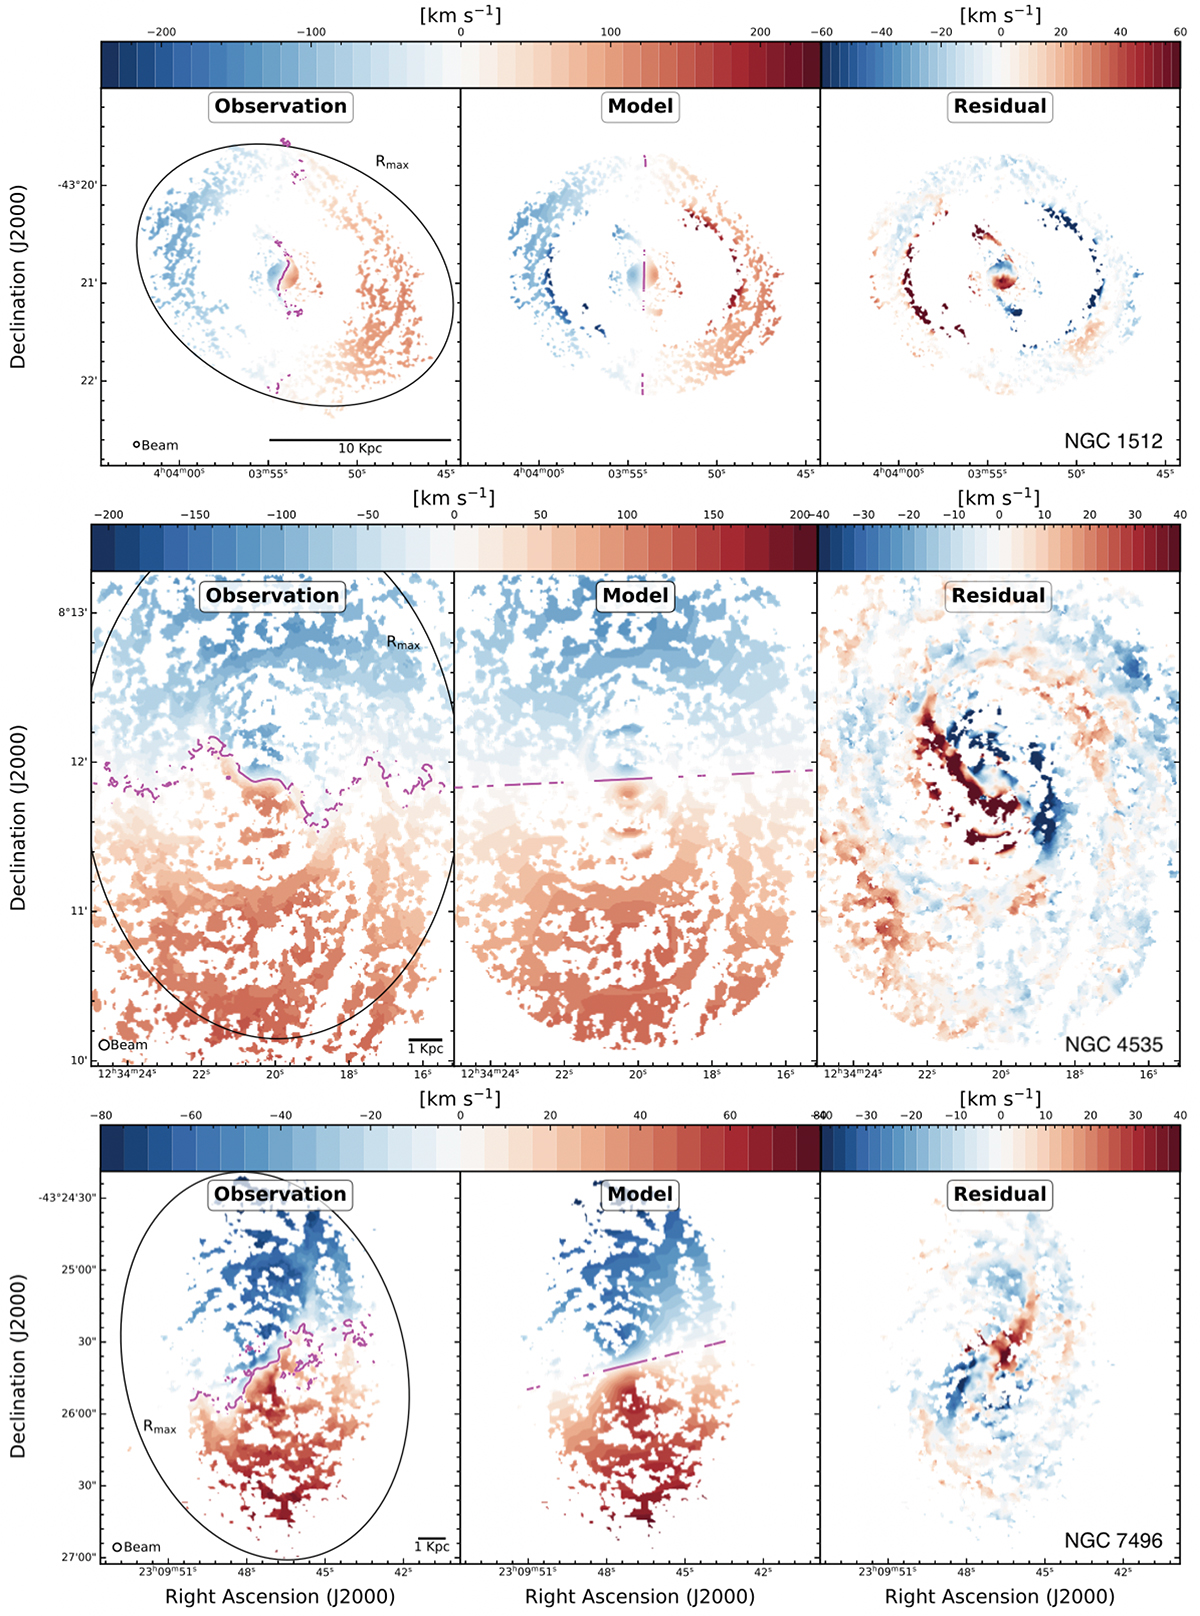
Fig. 6.
Download original image
Left column: First-moment map of the CO observations for NGC 1512 (top), NGC 4535 (middle), and NGC 7496 (bottom). The black ring indicates the outermost radius that was used for the model. The pink line tracks the systemic velocity line. Middle column: First-moment map of the H I model using the best-fit parameters found. Right column: Residual velocity field between the observation and the model. Models and residuals larger than Rmax are not shown due to unphysical results as discussed in Section 3 as part of the second run.
Current usage metrics show cumulative count of Article Views (full-text article views including HTML views, PDF and ePub downloads, according to the available data) and Abstracts Views on Vision4Press platform.
Data correspond to usage on the plateform after 2015. The current usage metrics is available 48-96 hours after online publication and is updated daily on week days.
Initial download of the metrics may take a while.