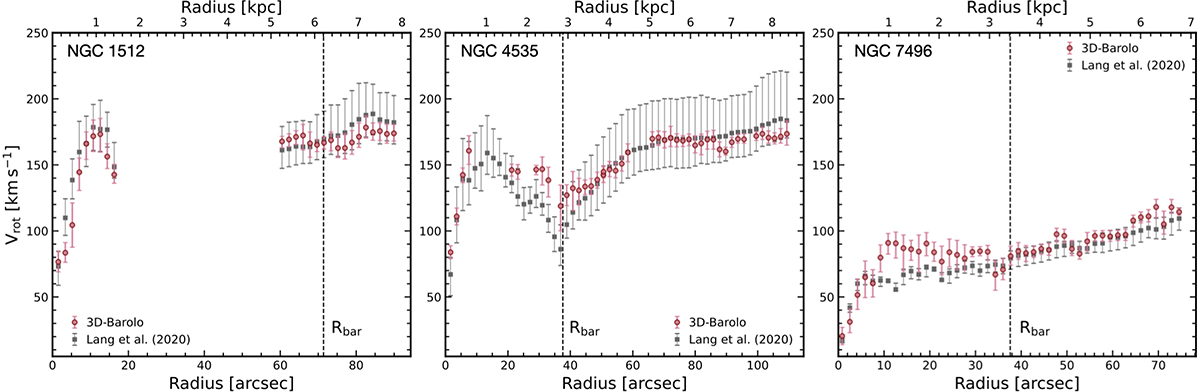
Fig. 4.
Download original image
PHANGS-ALMA CO rotation curve of the sample produced by 3D-Barolo (black circles). The previous fits by Lang et al. (2020) are plotted as grey squares. The radius of the galactic bar is indicated by the vertical dashed line. Some bins of the 3D-Barolo rotation curves did not converge and are therefore not represented. The two different methods lead to very similar results overall. The rotation curve of NGC 1512 has a large area without data points, which corresponds to regions with too few emissions for reliable fitting.
Current usage metrics show cumulative count of Article Views (full-text article views including HTML views, PDF and ePub downloads, according to the available data) and Abstracts Views on Vision4Press platform.
Data correspond to usage on the plateform after 2015. The current usage metrics is available 48-96 hours after online publication and is updated daily on week days.
Initial download of the metrics may take a while.