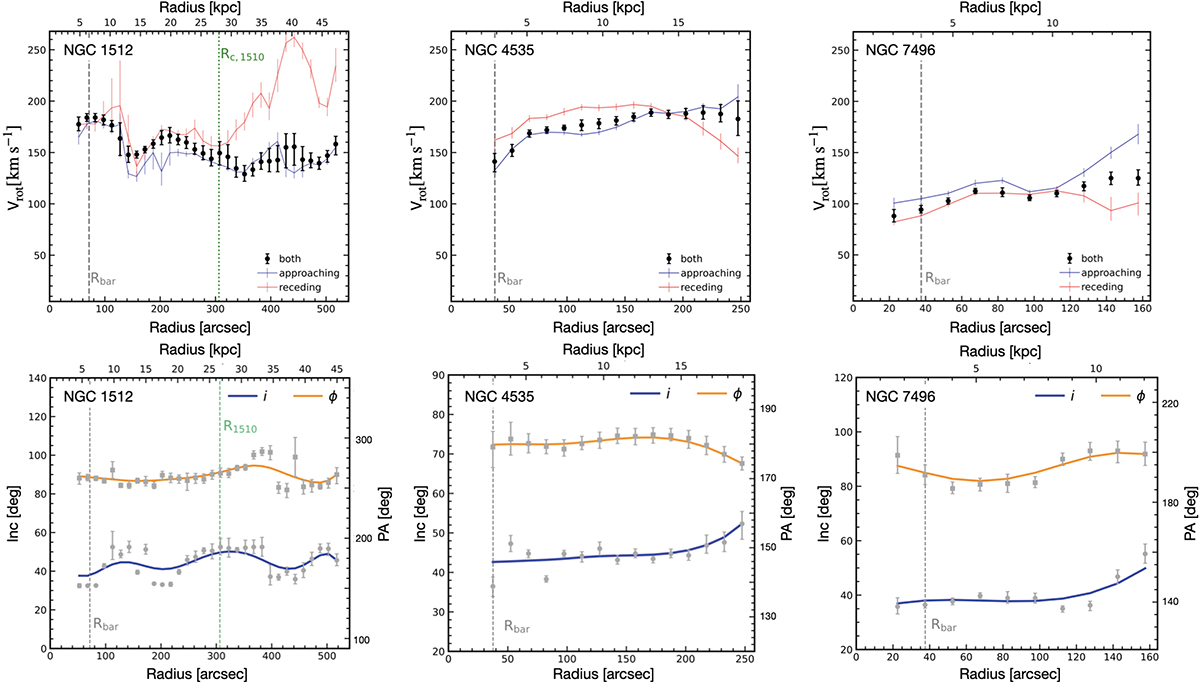
Fig. 3.
Download original image
Top row: Final H I rotation curves (black circles) for NGC 1512 (left), NGC 4535 (middle), and NGC 7496 (right) overplotted with rotation curves derived by only considering the approaching (blue) and the receding (red) side of the galaxy. The bar radius is indicated with a dashed grey line and the distance of NGC 1510 is indicated with the green dashed line. Bottom row: The panels show the adopted geometry in our fitting procedure for NGC 1512 (left), NGC 4535 (middle) and NGC 7496 (right) for the H I observations. The grey squares and circles represent the inclination i and position angle ϕ results for each ring after the second fitting stage, respectively. The blue (inclination) and yellow (position angle) lines represent the regularization function that was used to smooth out the geometry in the final stage of the fitting procedure.
Current usage metrics show cumulative count of Article Views (full-text article views including HTML views, PDF and ePub downloads, according to the available data) and Abstracts Views on Vision4Press platform.
Data correspond to usage on the plateform after 2015. The current usage metrics is available 48-96 hours after online publication and is updated daily on week days.
Initial download of the metrics may take a while.